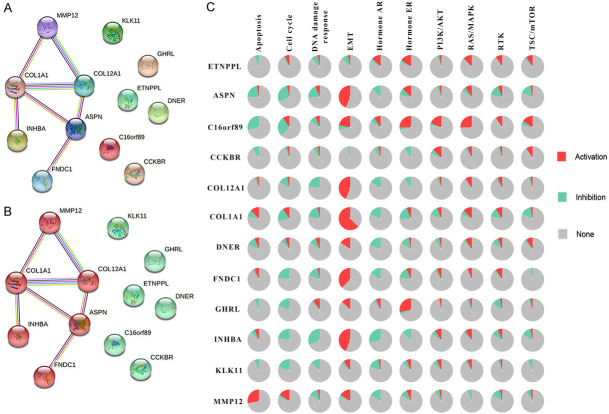
Figure 5.
The function analysis of DEGs network. A, B. The PPI network of 12 DEGs. Each circle represents one single gene. The edge with different colors represents different interactions. C. The pie chart shows the activation and inhibition percentage of each pathway among GC patients. The legend was listed on the right.

