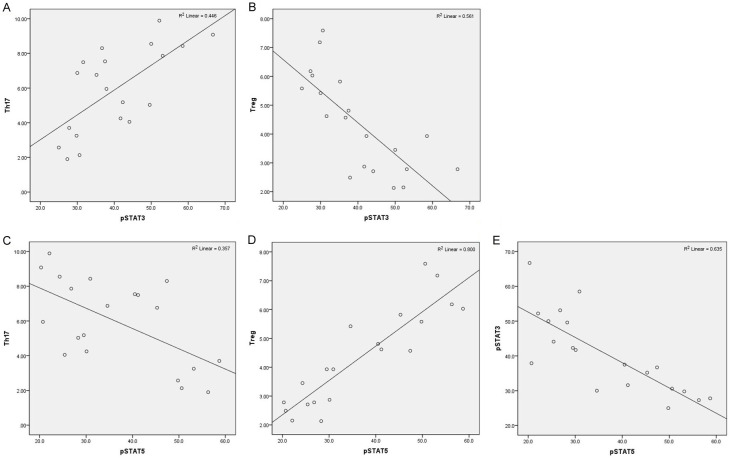
Figure 3.
Correlations of various cells in the whole T cell population analysed by Pearson correlation analysis. A. Correlation between the number of Th17 cells and pSTAT3+ cells. B. Correlation between the number of Treg cells and pSTAT3+ cells. C. Correlation between the number of Th17 cells and pSTAT5+ cells. D. Correlation between the number of Treg cells and pSTAT5+ cells. E. Correlation between the number of pSTAT3 and pSTAT5 cells. Pearson correlation coefficient was used in this section to show statistical dependence or correlation between two variables.

