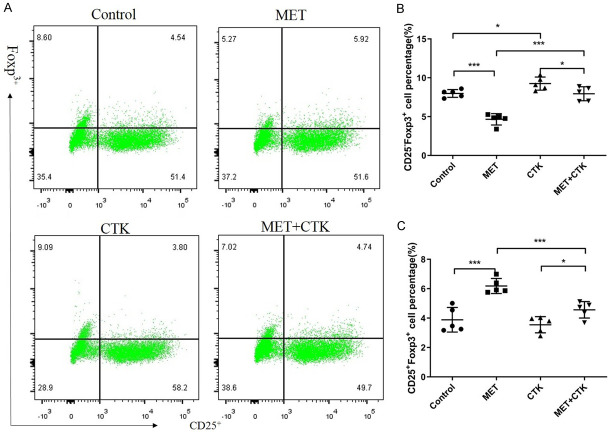
Figure 4.
Effect of metformin on the stability of Treg cells. A. Representative flow cytometry analysis of Th-like (CD25-Foxp3+) Treg cells and conventional (CD25+Foxp3+) Treg cells in each group. T cells were gated within the CD4+ population. B. The influence of metformin treatment on the number of Th-like Treg cells. C. The influence of metformin treatment on the number of conventional Treg cells. Comparisons among multiple groups were conducted by one-way ANOVA. *P < 0.05; ***P < 0.001.

