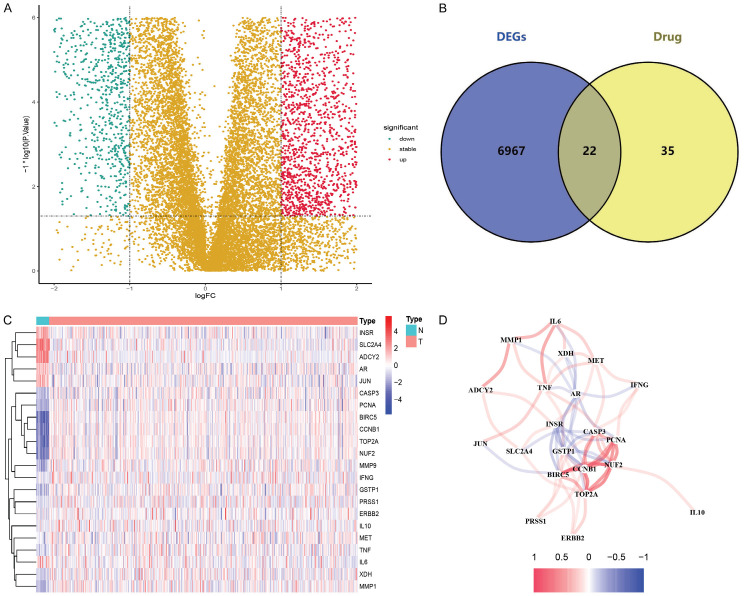
Figure 2.
Drug-related differential genes of endometrial cancer and interactions. A. Volcano plot of 6989 differential-drug genes in endometrial cancer; B. Venny plot of 22 drug-related differential genes (DR-DEGs); C. Heatmap of 22 DR-DEGs (N: normal group, T: tumor group; red represents high gene expression, blue represents low gene expression, and the depth of color represents the level of expression); D. The relationship between 22 DR-DEGs (red line is positive correlation, blue line is negative correlation, and the depth of color represents the strength of the correlation).

