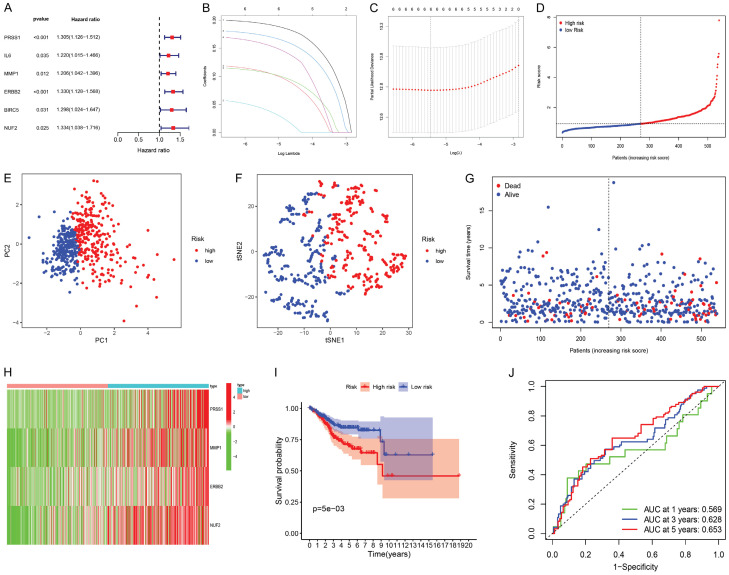
Figure 4.
Construction and validation of a genetic prognostic model. A. Forest plot of 6 DR-DEGs associated with endometrial cancer survival was constructed by univariate regression analysis; B. Least absolute shrinkage and selection operator (LASSO) of 6 genes analysis coefficient spectrum distribution; C. Cross-validation of optimal parameter selection in LASSO regression. D. Distribution map of patients in high and low risk groups based on risk score; E. Principal Component Analysis (PCA) plot based on risk score; F. t-distributed Stochastic Neighbor Embedding (t-SNE) map based on risk score; G. Survival status map of patients in high and low risk groups (left side of the dotted line, low risk group; right side of the dotted line, high risk group); H. Heatmap of DR-DEGs associated with prognostic features of endometrial cancer; I. Kaplan-Meier analysis curve of prognosis related to high and low risk groups; J. Time-dependent receiver operating characteristic (ROC) curve, the area under the curve (AUC) at 1 year, 3 years, and 5 years is 0.569, 0.628, and 0.653.

