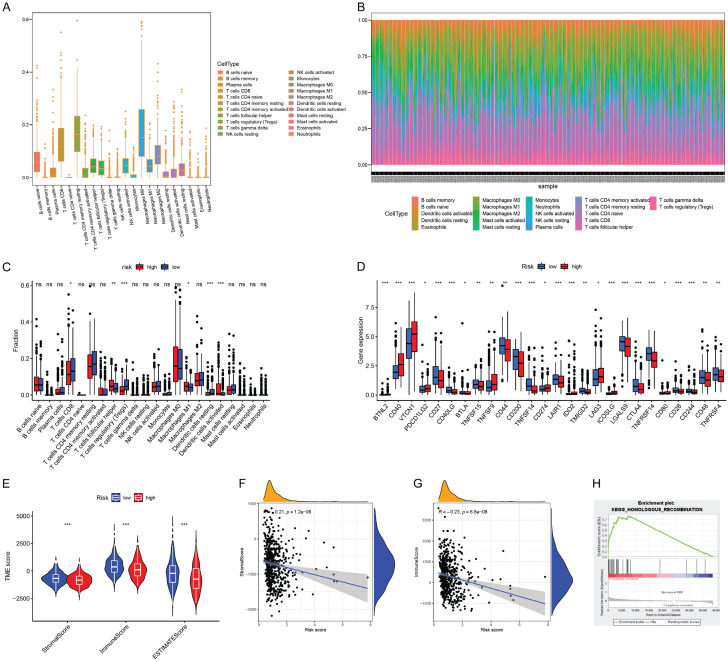
Figure 5.
tumor microenvironment (TME) and immune infiltration and Gene Set Enrichment Analysis (GSEA). A. The distribution of each individual immune cell in the total number of UCEC patients; B. The levels of individual immune cells in each UCEC tumor patient; C. Infiltration scores in the high and low risk groups; D. The immune checkpoint gene expression level in the high and low risk groups. E. The tumor microenvironment of the high and low risk groups; F, G. Correlation between immune cell scores and risk scores; H. The “homologous recombination” pathway is more active in the high-risk group.

