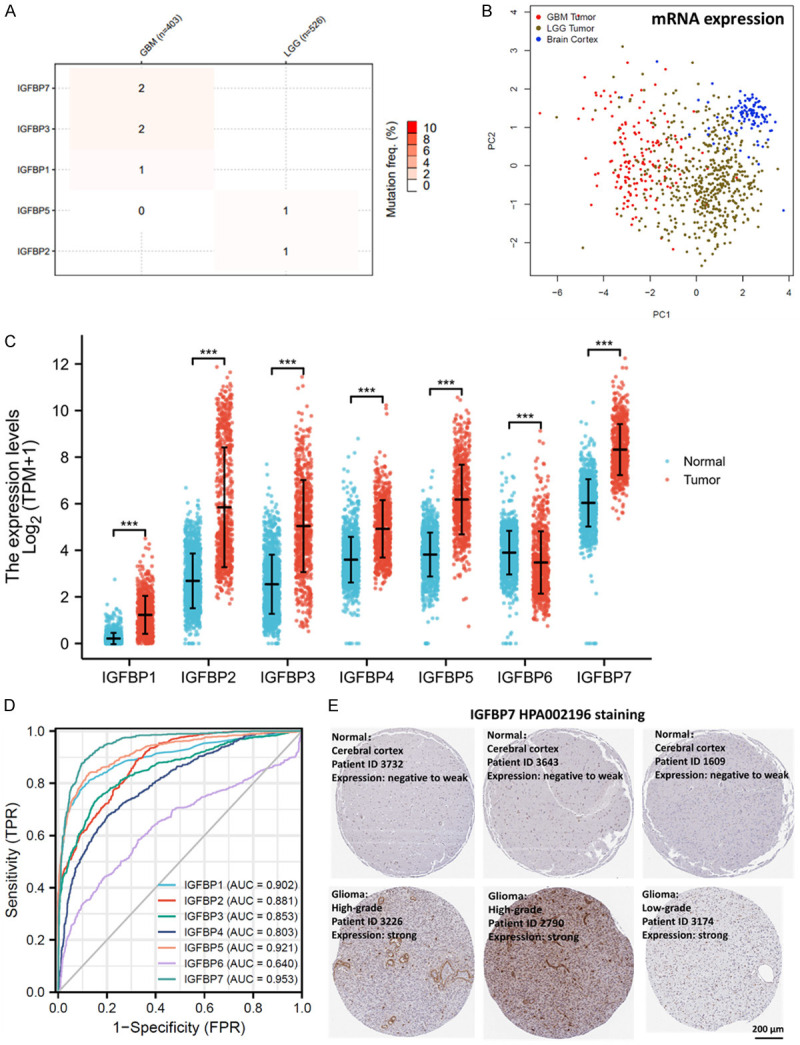
Figure 1.

Diagnostic value of IGFBPs for glioma. A. Single-nucleotide variant percentage heatmap of glioma. TCGA (LGG+GBM) cohort was analyzed. B. PCA dimensionality reduction on the mRNA expression of IGFBPs from glioma and normal brain cortex tissues based on their expression of IGFBPs. TCGA (LGG+GBM) and GETx cohorts were compared. C. The mRNA expressions of IGFBPs in glioma (n=1157) and normal brain (n=689) tissues. TCGA (LGG+GBM) and GETx cohorts were compared. D. Diagnostic ROC curve of IGFBPs in glioma (LGG and GBM). TCGA (LGG+GBM) and GETx cohorts were analyzed. E. Representative immunohistochemical images of IGFBP protein in glioma and normal brain tissues (100X). Antibody staining of IGFBP7 protein in normal brain and glioma tissues were downloaded from the Human Protein Atlas and shown as representative images. *P<0.05, **P<0.01,***P<0.001. GBM: glioblastoma; LGG: low grade glioma; TPM: transcripts per million; ID: identity number; TPR: True Positive Rate; FPR: False Positive Rate; AUC: Area under the ROC Curve; ROC: Receiver operating characteristic.
