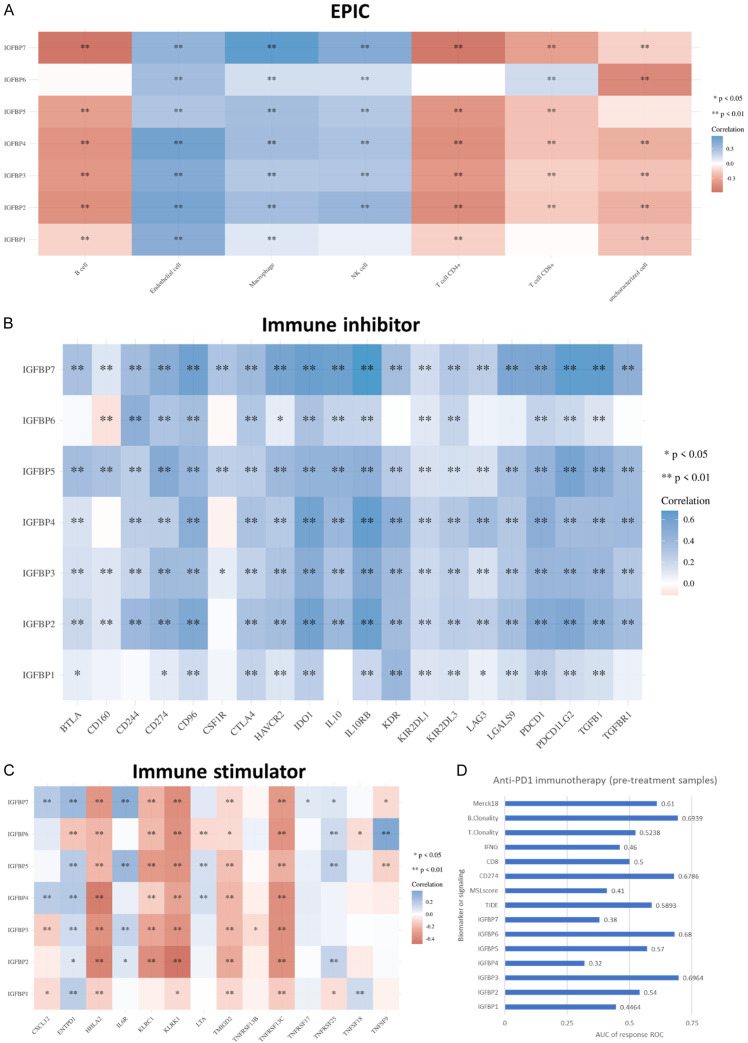
Figure 5.
Immunity association of IGFBPs in glioma. A. Correlations of immune cell infiltration levels and expression of IGFBPs. The EPIC (Estimating the Proportions of Immune and Cancer cells) algorithms were used to estimate the immune cell infiltration levels. TCGA (LGG+GBM) mRNA expression cohort was analyzed. B. Correlations of expressions of immune inhibitors and expressions of IGFBPs. TCGA (LGG+GBM) mRNA expression cohort was analyzed. C. Correlations of expressions of immune stimulators and expressions of IGFBPs. TCGA (LGG+GBM) mRNA expression cohort was analyzed. D. AUC of anti-PD1 immunotherapy response ROC (responders n=8, non-responders n=7). SRA PRJNA482620 data were accessed and analyzed using the TIDE.

