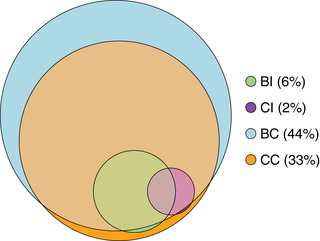
Fig. 1.

Venn diagram showing the overlap between four different approaches to characterising multiple long‐term conditions. BC, body system count; BI, Byles index; CC, condition count; CI, Charlson index. Percentages shown indicate the proportion of participants with two or more conditions according to the criteria for each of the four approaches.
