
FIGURE 3.
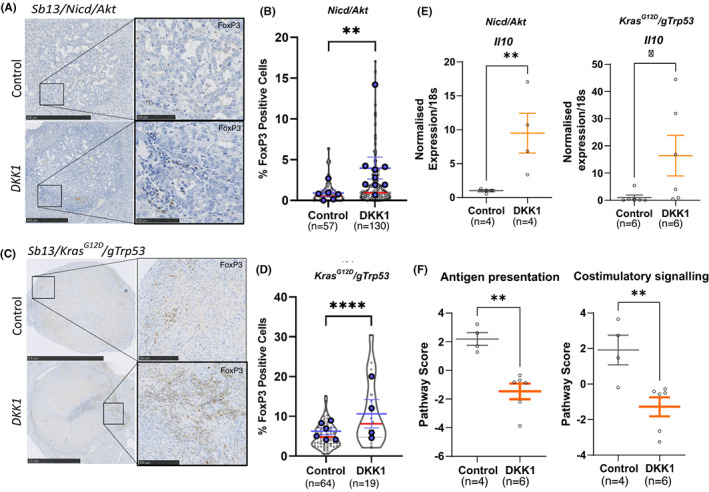
DKK1 overexpression promotes the formation of a tolerogenic immune microenvironment in cholangiocarcinoma (CCA). (A) Immunohistochemical staining for FOXP3 (brown) in Nicd/Akt‐driven cancers with and without DKK1 expression (scale bars = 500 μm [insets = 250 μm]). (B) Quantification of FOXP3 staining in Nicd/Akt and Nicd/Akt/DKK1 tumours (n = 57 vs 130). Positive cells are shown as a percentage of total cells in the tumour area (violin plots with red median lines) (p = .0076, unpaired Student's t‐test), while average measurements per animal are superimposed in blue with mean and SEM shown. (C and D) Equivalent data to A and B above for the tumours in the Kras G12D /gTrp53 HTVI model (scale bars = 2.5 mm [insets = 250 μm]) (n = 64 vs 19) (p < .001, unpaired Student's t‐test). (E) Real time qPCR of Il10 expression from tumours in the Nicd/Akt and Kras G12D /gTrp53 models. Points show relative expression values normalized to 18 s RNA expression in control and DKK1 overexpressing tumours, bars represent mean values and SEM for n = 4 vs 4 tumours (Nicd/Akt, p = .0017) and n = 6 vs 6 (Kras G12D /gTrp53, p = .0107). (F) NanoString gene expression data showing combined gene expression scores for antigen presentation and costimulatory signalling, bars represent the mean and SEM (p = .0014 and p = 0.0093 respectively).