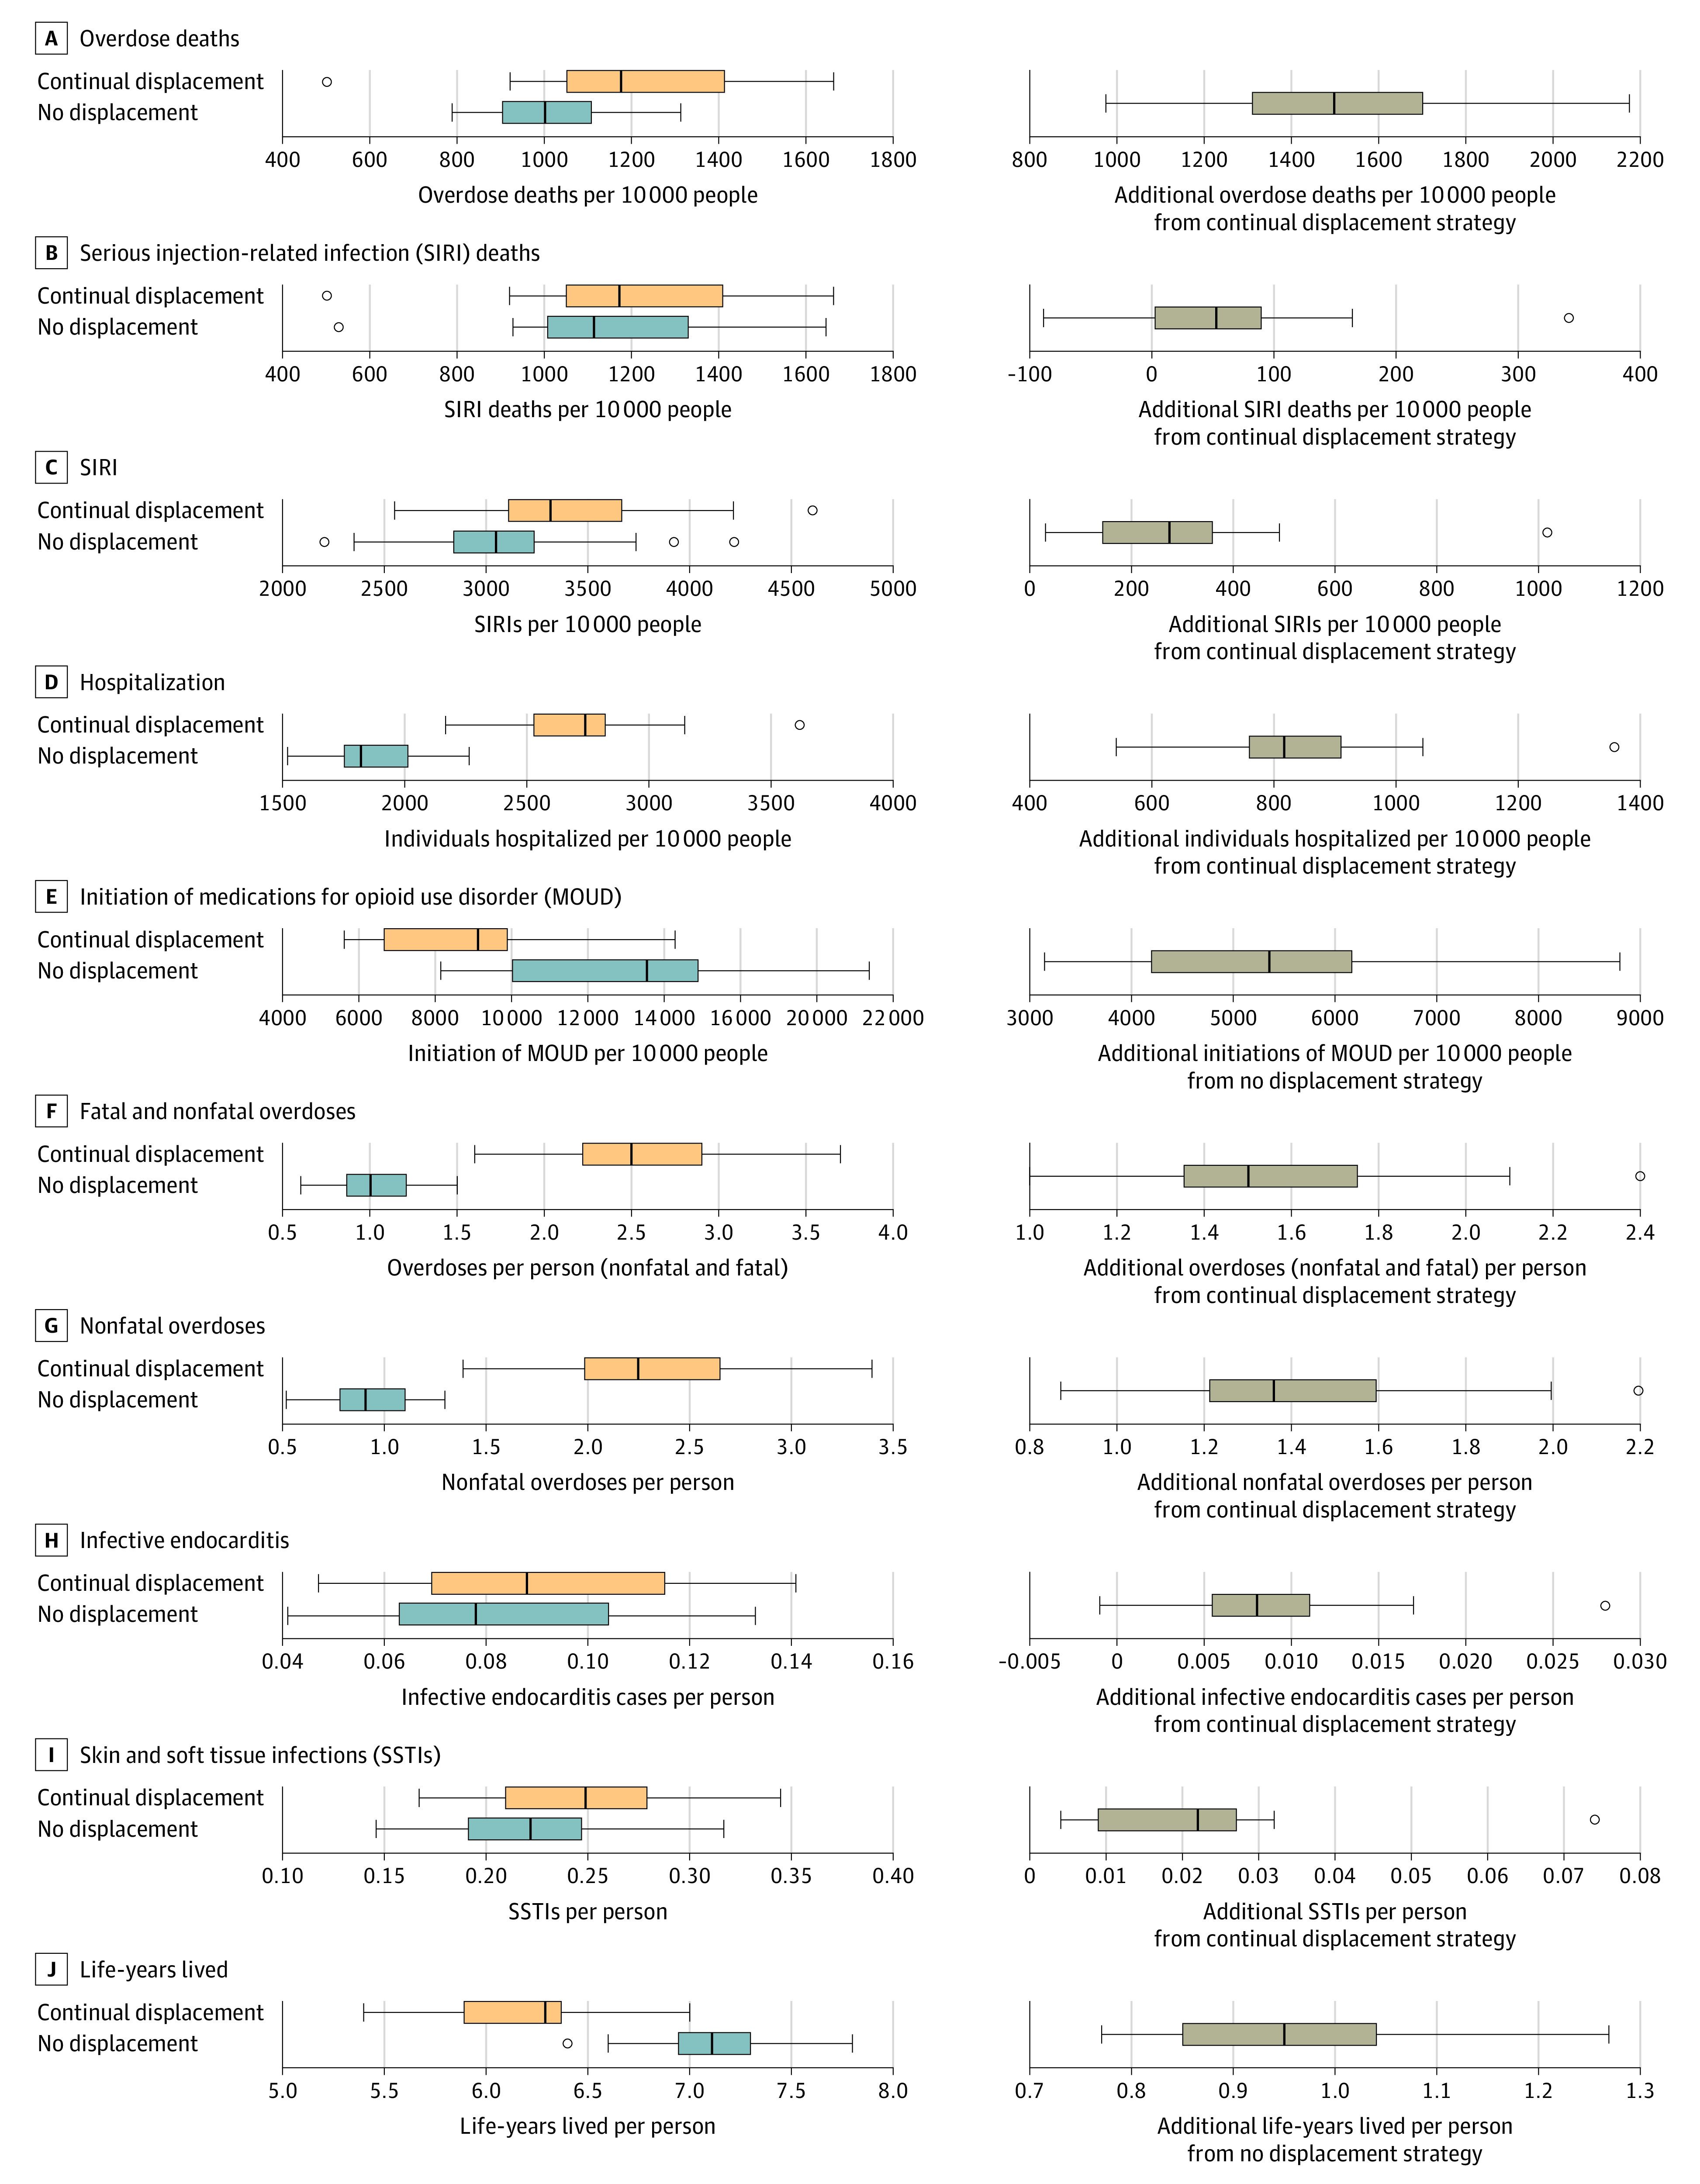
Figure 2. Ten-Year Modeled Clinical Outcomes for “No Displacement” and “Continual Involuntary Displacement” Strategies.

Plots on the left show the ranges of the absolute numbers for each clinical outcome for the “no displacement” and “continual involuntary displacement” strategies and plots on the right show the absolute differences for each clinical outcome between the 2 strategies (medians noted with black lines). Boxes denote first to third quartiles. Whiskers extend to extreme observed values with 1.5 × the IQR of the nearer quartile. Circles denote outside values. An individual could have more than 1 MOUD initiation.
