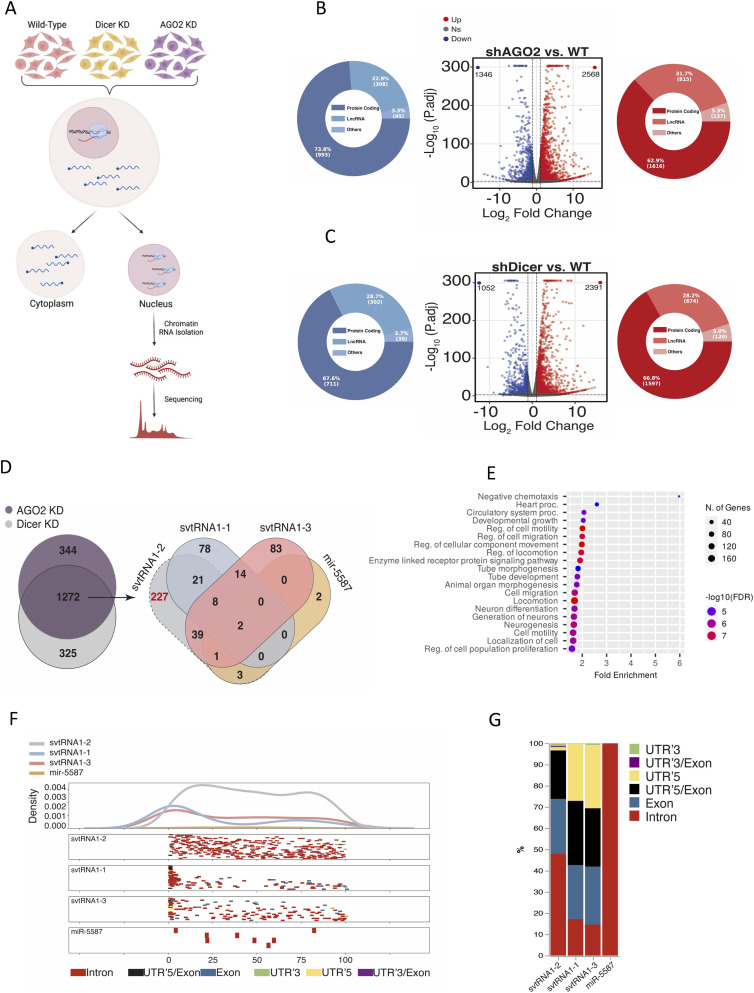
Figure 3. svtRNA1-2 targets selected genes at the nascent RNA level.
(A) Schematic representation of the ChrRNA-seq method. (B) Volcano plots of differentially expressed genes in AGO2 KD conditions. The red points and blue points show up-regulated genes and down-regulated genes with log2FC > 1 and log2FC < −1 and P-adj < 0.001, respectively. Pie charts show different gene types of up (red)- or down (blue)-regulated genes. (B, C) As in (B) using Dicer KD samples. (D) Venn diagram shows an overlap of up-regulated protein-coding genes from Dicer and AGO2 KD conditions (left). Venn diagram shows the number of predicted target genes for svtRNA1-1/2/3 and miR-5587 (right). svtRNA1-1/3 and miR-5587 were used as controls as their sequence similarity has the highest score with svtRNA1-2. (E) GO analysis of vtRNA1-2 predicted targets up-regulated in AGO2 and Dicer KD samples. (F) Metagene distribution of predicted svtRNA binding sites mapped along normalised target transcript length and their corresponding gene features. (G) svtRNA binding site counts normalised to the length of a feature displayed in overall percentage.

