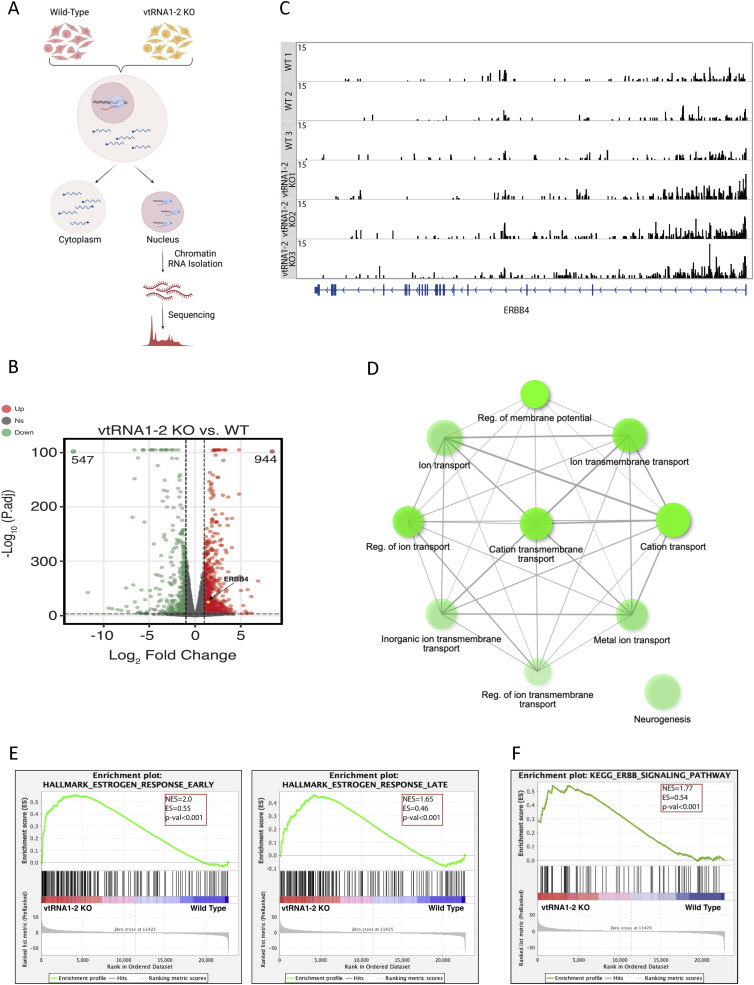
Figure 5. Deletion of vtRNA1-2 alters the expression of genes associated with cellular membrane function.
(A) Schematic representation of the ChrRNA-seq method. (B) IGV tracks of ChrRNA-seq from WT and vtRNA1-2 KO cells displaying the ERBB4 reads. The bottom blue line indicates the composition of the ERBB4 gene. (C) Volcano plots of differentially expressed genes in vtRNA1-2 KO and WT conditions. The red points and green points show up-regulated genes and down-regulated genes with log2FC > 1 and log2FC < −1 and P-adj < 0.001, respectively. The yellow point shows ERBB4. (D) GO analysis of up-regulated genes in vtRNA1-2 KO when compared to WT. (E) Gene set enrichment analysis with a gene set from vtRNA1-2 KO cells using Hallmark gene sets in MSigDB. Genes are ranked by Wald’s statistic values in a ChrRNA-seq experiment (KO versus WT). A positive enrichment score indicates higher expression after vtRNA1-2 KO. (F) Gene set enrichment analysis with a gene set from vtRNA1-2 KO cells using KEGG pathways.

