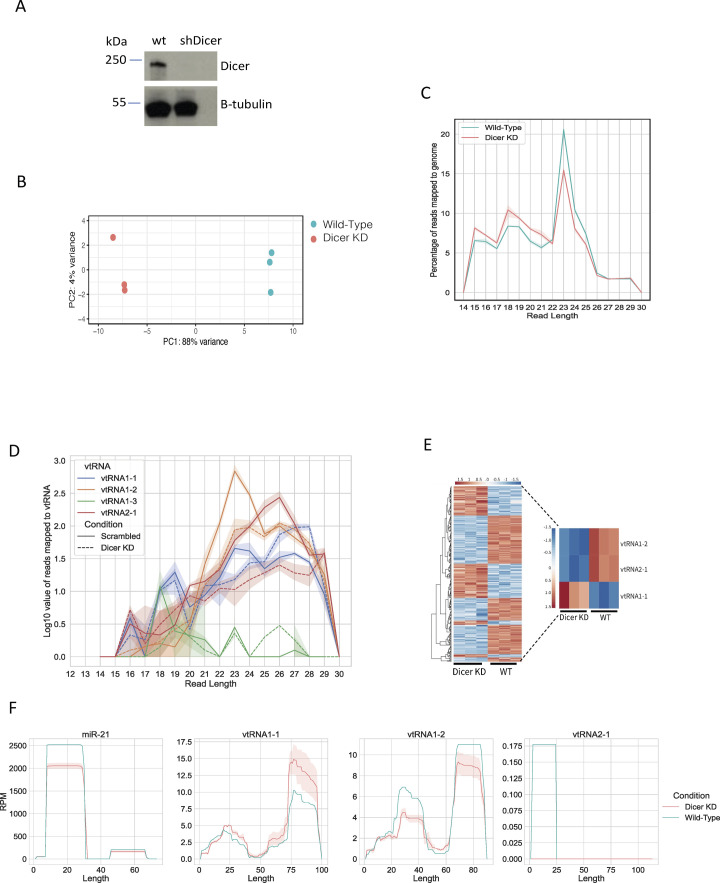
Figure S1. Analysis of small RNA-seq.
(A) Representative Western blot showing Dicer protein levels in WT and Dicer KD cells. Samples were collected 3 d after addition of doxycycline. (B) Principal component analysis plot shows three biological replicates corresponding to the samples from HEK293T cells in WT and Dicer KD conditions. The RNA composition of cells in the WT condition differed significantly from those in the Dicer KD condition. (C) Size distribution of mapped reads to the human genome in Dicer KD and WT conditions. (D) Size distribution of mapped reads to the vault RNA in Dicer KD (dashed line) and WT (full line) conditions. The shaded area around the line represents the SD of the mean. (E) Heatmap showing small RNA-seq data upon knockdown of Dicer in HEK293T cells. The colour scale indicates normalised intensities (z-score). The heatmap contains all genes that were significantly altered (adjusted P < 0.05) upon Dicer KD. Zoomed heatmap shows significantly expressed vtRNA genes. (F) Per-base read coverage of vtRNA. The x-axis shows the length of transcripts, and the y-axis shows the normalised number of mapped reads in RPM (Reads Per Million). miR-21 acts as a positive control.

