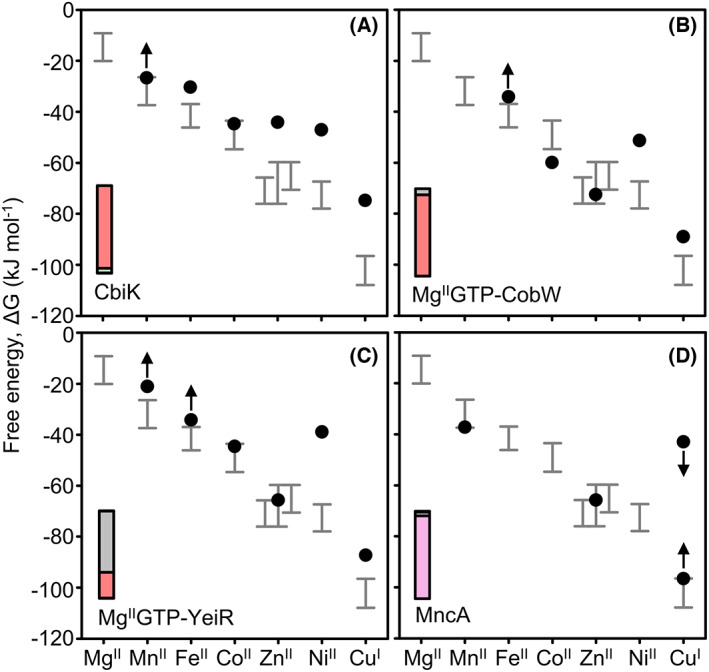
Fig. 2.

Metal availability is the inverse of the Irving–Williams series and decodes correct metalation. Grey bars show the ranges from 10% to 90% of the transcriptional responses of the cognate sensors for each metal as free energies for forming complexes that would be 50% saturated at the respective availability [3]. Metal availability is inverse to the Irving–Williams series. The ranges indicate the range of strengths of competition from exchangeable cytosolic binding sites against which the sensors have evolved to compete to sustain optimal metal availabilities. Metalation of other proteins similarly involves competition with these exchangeable metal binding sites. Black circles and arrows replicate metal binding data from Fig. 1, except for limits to CuI binding to MncA where the weakest value is derived from a competition experiment and the tightest inferred to give negligible (1%) CuI occupancy. The four cognate metals become apparent when binding is considered in relation to availability, as shown in the insets with CoII (salmon red), ZnII (grey), MnII (pink) [3, 5]. These proportional metal occupancies are calculated for idealised cells in which the sensors are at the mid‐points of their ranges. Total calculated metal occupancies are 16% CbiK, 99% MgIIGTP‐CobW, 36% MgIIGTP‐YeiR and (using the selected K A MnII) 91% MncA, implying substantial amounts of apo‐CbiK and apo‐YeiR exist under these conditions. Online metalation calculators similarly decode metal occupancies in the context of defined metal availabilities (https://mib‐nibb.webspace.durham.ac.uk/metalation‐calculators/) [53].
