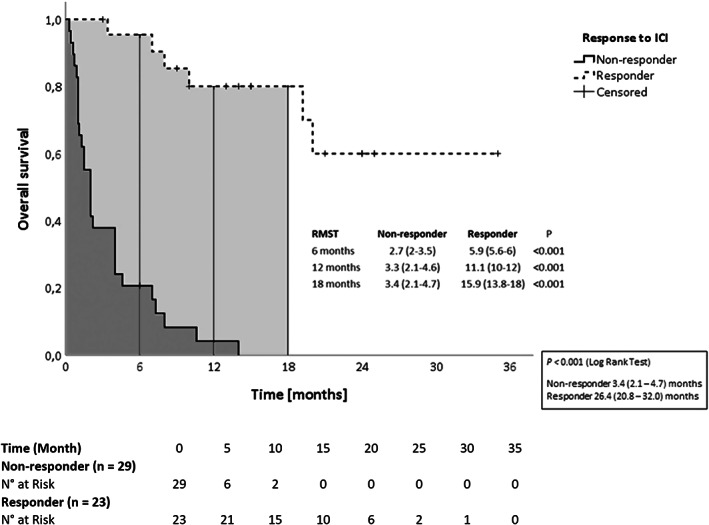
FIGURE 2.

Kaplan–Meier curves of overall survival in patients are divided according to the presence of response to ICI therapy. Data in box are mean survival and confidence interval. ICI, immune checkpoint inhibitors; RMST, restricted mean survival time
