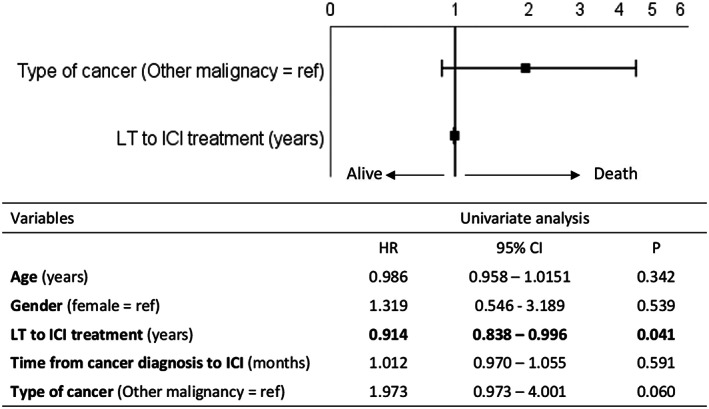
FIGURE 3.

Forrest plot of multivariate Cox regression analysis of overall survival. Dependent variables that entered the models were the type of cancer (0 = other malignancy, 1 = recurrence of HCC) and the time between LT and ICI administration (+1 year). The hazard ratio is expressed as the log10 function. The table below reports the results of the univariate analysis. HCC, hepatocellular carcinoma; ICI, immune checkpoint inhibitors; LT, liver transplantation
