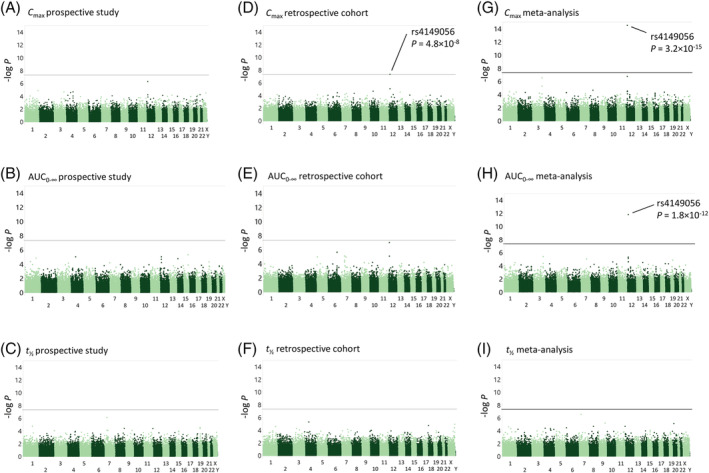
FIGURE 1.

Manhattan plots of pharmacokinetic variables of rosuvastatin. The results of the genome‐wide association analysis of the prospective study for peak plasma concentration (C max) (a), area under the plasma concentration–time curve from zero to infinity (AUC0–∞) (b), and elimination half‐life (t ½) (c) are shown on the left, the results of the cohort of previously published studies for peak plasma concentration (C max) (d), AUC0–∞ (e), and elimination half‐life (t ½) (f) are shown in the middle, and the results of the meta‐analysis of the prospective study and the cohort of previously published studies for C max (g), AUC0–∞ (h), and t ½ (i) on the right. Horizontal lines indicate the genome‐wide significance level of 5 × 10⁻⁸
