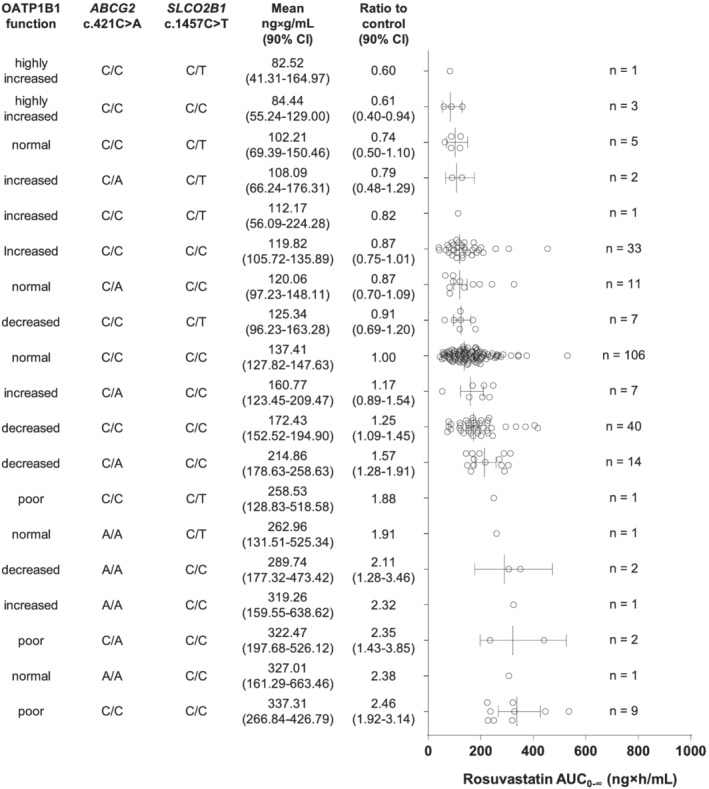
FIGURE 2.

Rosuvastatin area under the plasma concentration–time curve from zero to infinity (AUC0–∞) values in individuals divided into different classes based on the SLCO1B1 phenotype, ABCG2 diplotype and SLCO2B1 c.1457C > T genotype. Data are estimated marginal means with 90% confidence interval (CI). HIF, highly increased function; IF, increased function; NF, normal function; DF, decreased function; PF, poor function
