FIGURE 6.

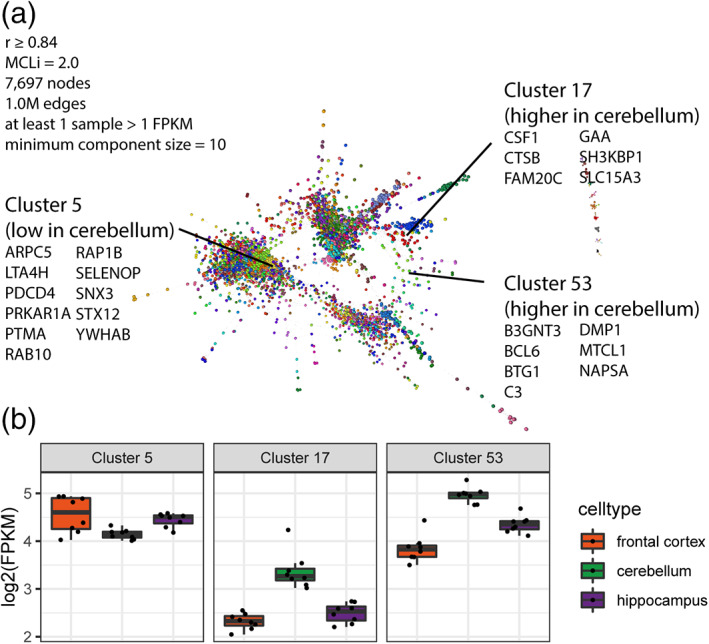
Gene–gene co‐expression network analysis of microglial samples. Co‐expression network analysis was carried out using all pig microglia samples (Table S11). (a) The co‐expression clustering method groups together genes showing similar pattern of expression across samples. Three clusters are found to be enriched in genes showing significant regional variation, Cluster 5, 17, and 53. (b) The average expression levels [log2(FPKM)] for frontal cortex (orange; n = 8), cerebellum (green; n = 8) and hippocampus (purple; n = 8) for Cluster 5, 17, and 53. Cluster 17 (e.g., CSF1, CTSB, SLC15A3) and 53 (e.g., C3, DMP1, NAPSA) are higher in expression in the cerebellum, while Cluster 5 (e.g., ARPC5, PDCD4, RAP1B) is lower in cerebellum.
