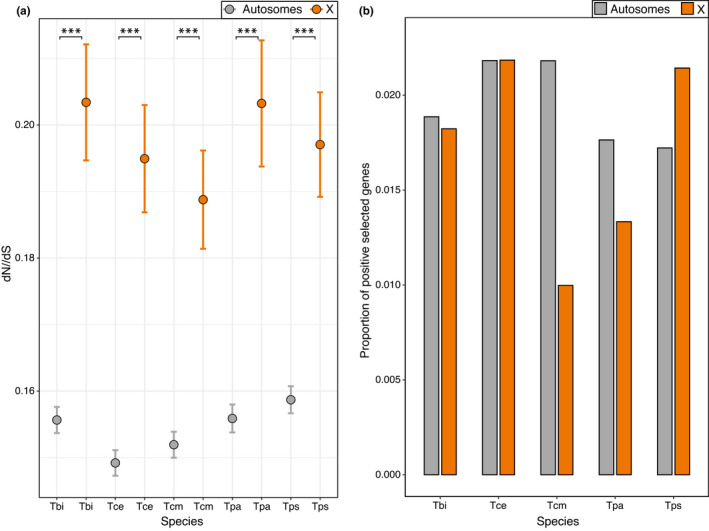
FIGURE 3.

Sequence evolution on the X and autosomes. (a) Average dN/dS across genes. Error bars indicate standard error. Asterisks indicate the significance (FDR) of Wilcoxon tests (***<0.001, **<0.01, *<0.05). (b) Proportion of positively selected genes. Positively selected genes were not enriched on the X chromosome (Fisher's exact test p value = 0.50). Species names are abbreviated as Tbi = T. bartmani, Tce = T. cristinae, Tcm = T. californicum, Tps = T. poppensis and Tpa = T. podura.
