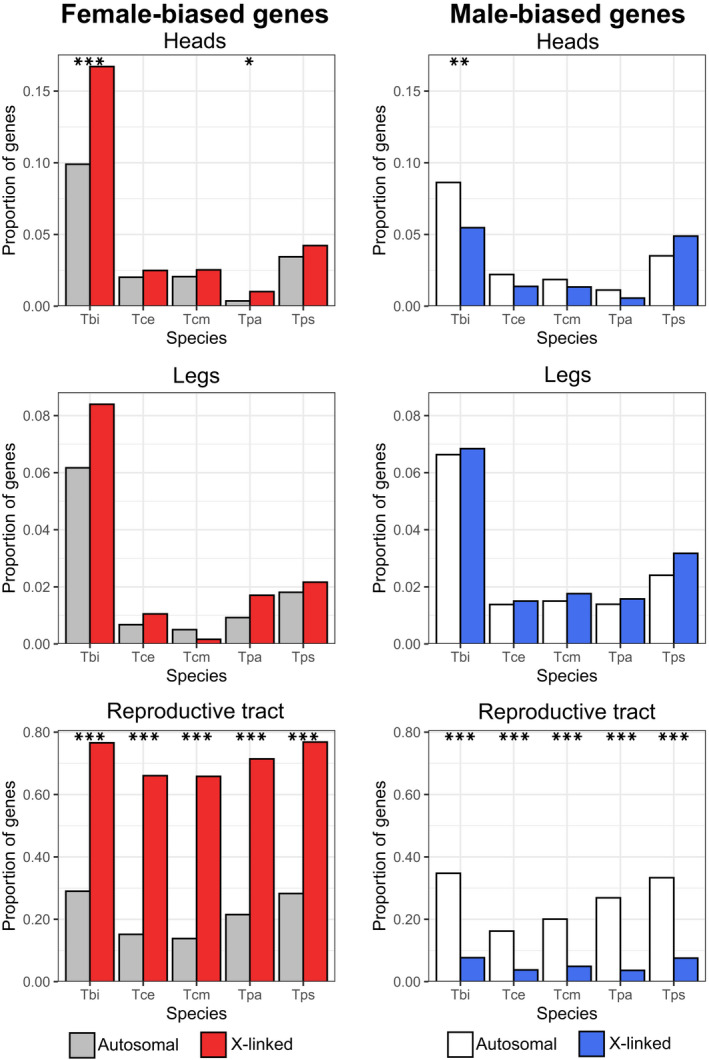
FIGURE 6.

Proportion of female‐ and male‐ biased genes on the X and autosomes in reproductive tract, head and leg samples. Note the scale changes between tissue‐types. Asterisks indicate the significance level (FDR) of Fisher's exact tests (***<0.001, **<0.01, *<0.05). Species names are abbreviated as Tbi = T. bartmani, Tce = T. cristinae, Tcm = T. californicum, Tps = T. poppensis and Tpa = T. podura.
