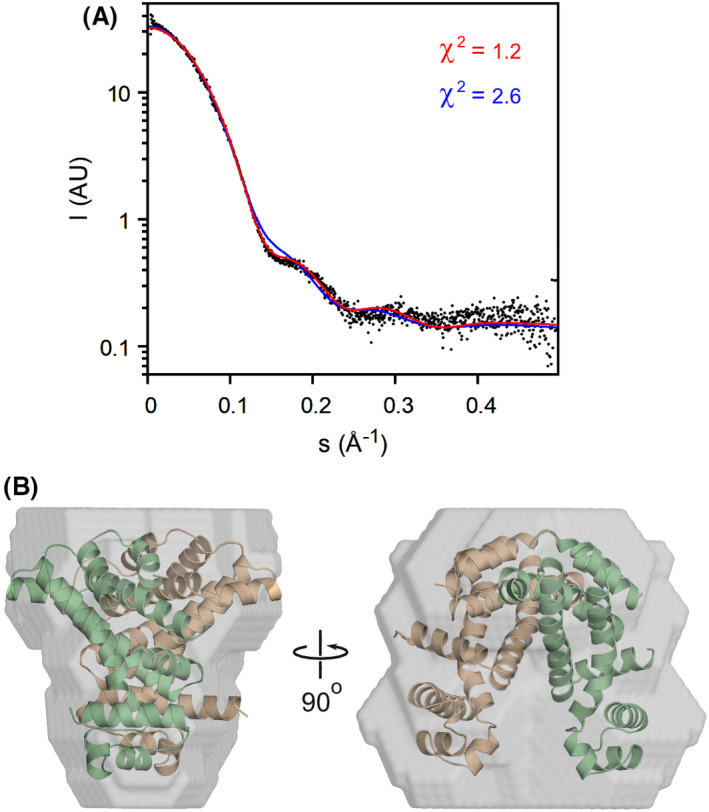
Fig. 4.

SAXS analysis of SCO3201 in solution. (A) Experimental SAXS data (black dots) and theoretical curves calculated for the ligand‐free (red) and ligand‐bound (blue) crystallographic structures. Theoretical curves were fitted to the experimental data using CRYSOL, with 7PT0 and the CD dimer of 5EFY as the models, respectively. (B) Ab initio model (grey surface) with the superposed 5EFY CD dimer shown in ribbon representation (beige and green).
