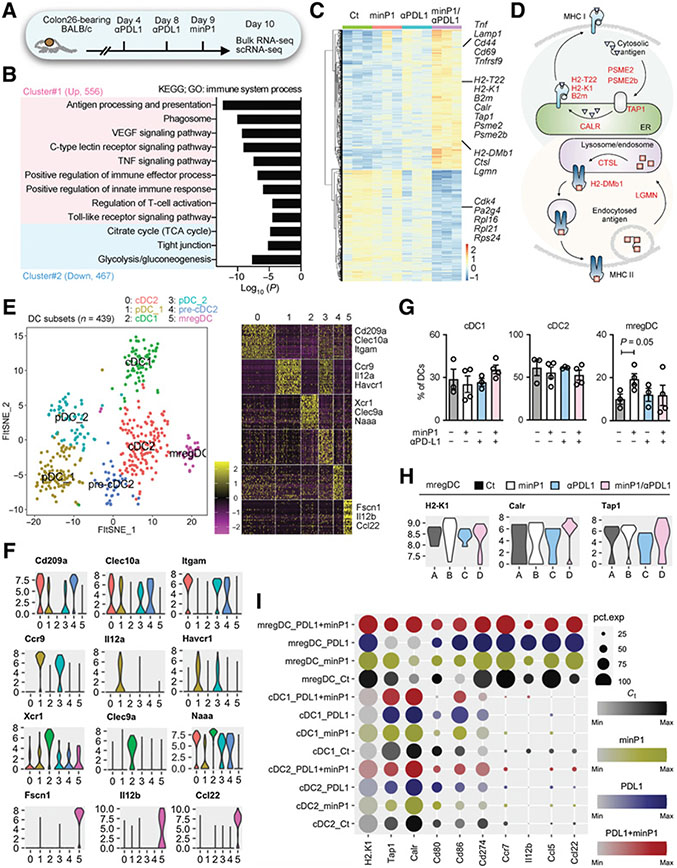
Figure 3.
minP1 transcriptionally upregulates the MHC class I antigen presentation program in intratumoral mregDCs. A, Schema for the preparation of tumor cell suspensions from Colon26 tumor–bearing mice for bulk RNA-seq (n = 12, three mice for each treatment groups) and scRNA-seq (n = 14, three mice for untreated control and anti–PD-L1 groups and four mice for minP1 and minP1/PD-L1 treatment groups) on day 10. B, GO analysis of DEGs upregulated (cluster #1) and downregulated (cluster #2) in the minP1/anti–PD-L1 treatment group. C, Heatmap of the 1,023 DEGs. Each column represents a group, and each row represents an individual gene. The Z-scores of module groups are shown at the bottom-right corner of the heatmap. D, Summary diagram of the antigen processing and presentation pathway components based on the KEGG pathway map04612 (https://www.genome.jp/dbget-bin/www_bget?path:map04612). E, A t-SNE projection and corresponding heatmap for scRNA-seq profiling of 439 DCs in tumors of Colon26 tumor–bearing mice. DC clusters are distinct colors. cDC1 (Xcr1, Clec9a, Naaa), cDC2 (Cd209a, Clec10a, Itgam), pDC (Ccr9, Il12ra, Havcr1), and mregDC (Fscn1, Il12b, Ccl22) were profiled. F, Violin plots showing the expression distribution of selected genes in different DC clusters. The y-axis represents log-normalized expression values. G, Proportion of DCs for cDC1, cDC2, and mregDC clusters in different treatment groups. H, Violin plots showing the expression distribution of selected genes (H2-K1, Calr, Tap1) in different treatment groups. The y-axis represents log-normalized expression values. I, Dot plots showing expression of antigen presentation (H2-K1, Tap1, Calr), DC immunostimulatory (Cd80, Cd86, Cd274), and cytokine and chemokine (Ccr7, Il12b, Ccl5, Ccl22) genes among DC clusters in different treatment groups. Node size is proportional to the expression frequency in a cell cluster. Node color max to min is proportional to the gene enrichment score in each cluster; black represents control (Ct) group. Yellow represents minP1 treatment group. Blue represents anti–PD-L1 treatment group. Red represents anti–PD-L1+minP1 treatment group.

