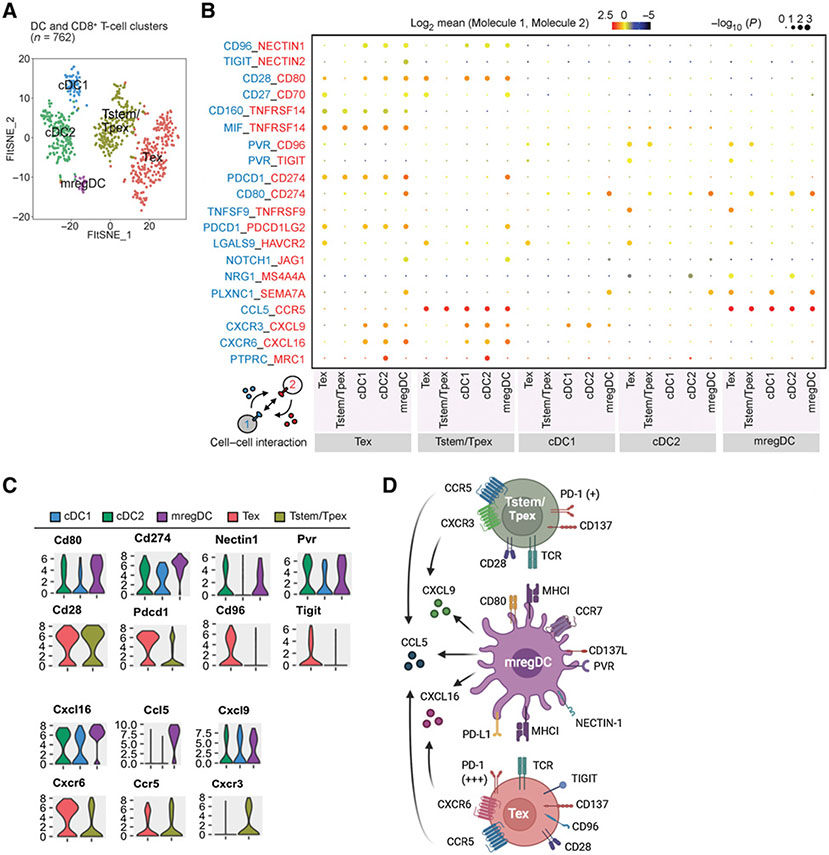
Figure 6.
CellPhonDB reveals the potential interactions between mregDCs, Tstem/Tpex cells, and Tex cells in tumors. A, A t-SNE projection of scRNA-seq profiling from 762 T cells and DCs in tumors of Colon26 tumor–bearing mice. T-cell and DC clusters are represented as distinct colors. B, Overview of select ligand–receptor interactions; P values are indicated by circle size [scale on right (permutation test)]. The means of the average expression of interacting molecule 1 in cell cluster 1 and interacting molecule 2 in cell cluster 2 are indicated by color. Assays were carried out at the mRNA level but were extrapolated to protein interactions. C, Violin plots exhibiting the expression distribution of selected genes in T-cell and DC clusters. The y-axis represents log-normalized expression values. D, Summary diagram of the main receptors and ligands expressed on the mregDC, Tstem/Tpex cell, and Tex cell clusters that were involved in cellular recruitment and costimulation/coinhibition. Created with BioRender.com.

