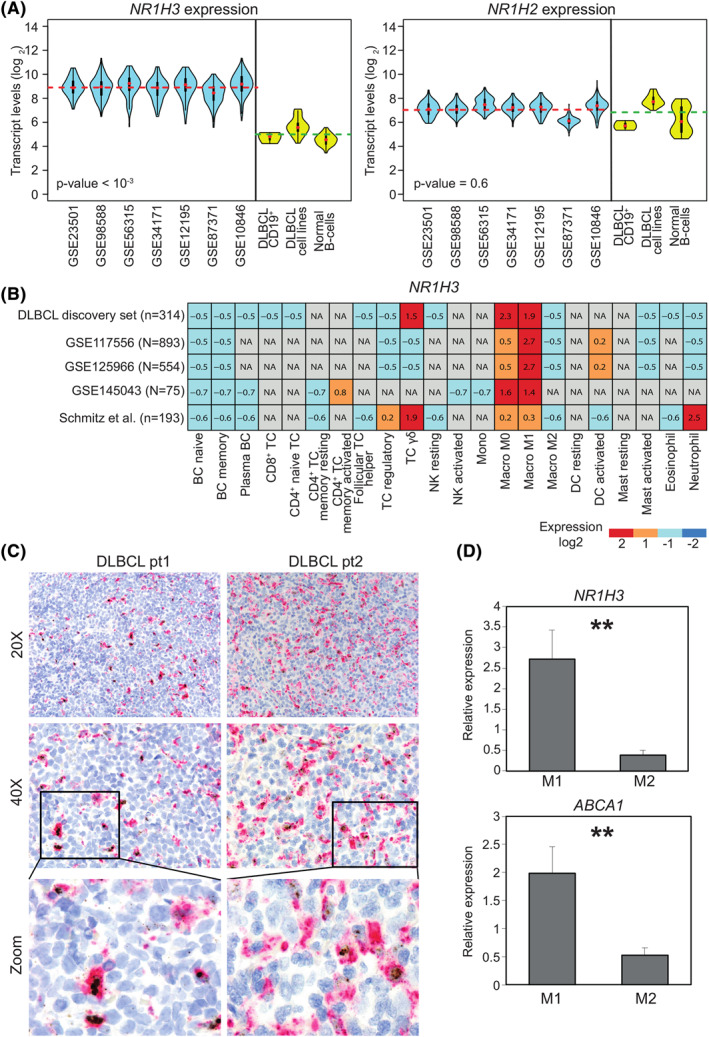
FIGURE 1.

NR1H3 is expressed by macrophages in diffuse large B‐cell lymphomas (DLBCL). A, Violin‐plots representing transcript abundance of NR1H3 (left panel) and NR1H2 (right panel) in publicly‐available datasets from bulk tumor samples (light blue) or purified primary samples, DLBCL cell lines and normal B‐cells (yellow). The gene expression omnibus accession numbers of DLBCL datasets are depicted in the x‐axis. Dotted lines indicate NR1H3 averaged expression respectively from bulk DLBCL samples (red) as well as purified DLBCL cell lines and normal B‐cells (green), including germinal center centroblasts, naïve and memory B‐cells (GSE12195 and GSE56314 datasets). p‐value as derived from Mann–Whitney U test comparing bulk samples with purified cells is shown. B, Heatmap depicting NR1H3 expression from in silico purification (CIBERSORTx) of different cell types five DLBCL datasets. Signal intensities ranking from highest (red) to lowest (blue) are indicated as row‐scaled expression values. C, Representative histological sections of two DLBCL cases showing different levels of NR1H3 transcript detected by RNA in situ hybridization (brown dots) and CD68 protein (magenta) by IHC using PG‐M1 antibody (20X and 40X magnification depicted on left and right panel, respectively). The panels at the bottom are magnifications showing representative double‐positive CD68+/NR1H3 + and single‐positive CD68+/NR1H3 ‐ cells. D, Bar plot representing NR1H3 and ABCA1 expression levels determined by quantitative real time polymerase chain reaction of in vitro generated Mo. Relative quantification of gene expression was analyzed by the 2−ΔΔCt method using 18S as the endogenous control. p‐value was derived from two‐tailed t test. Data are represented as the mean of four independent experiments ± SD (standard deviation). NA, not available
