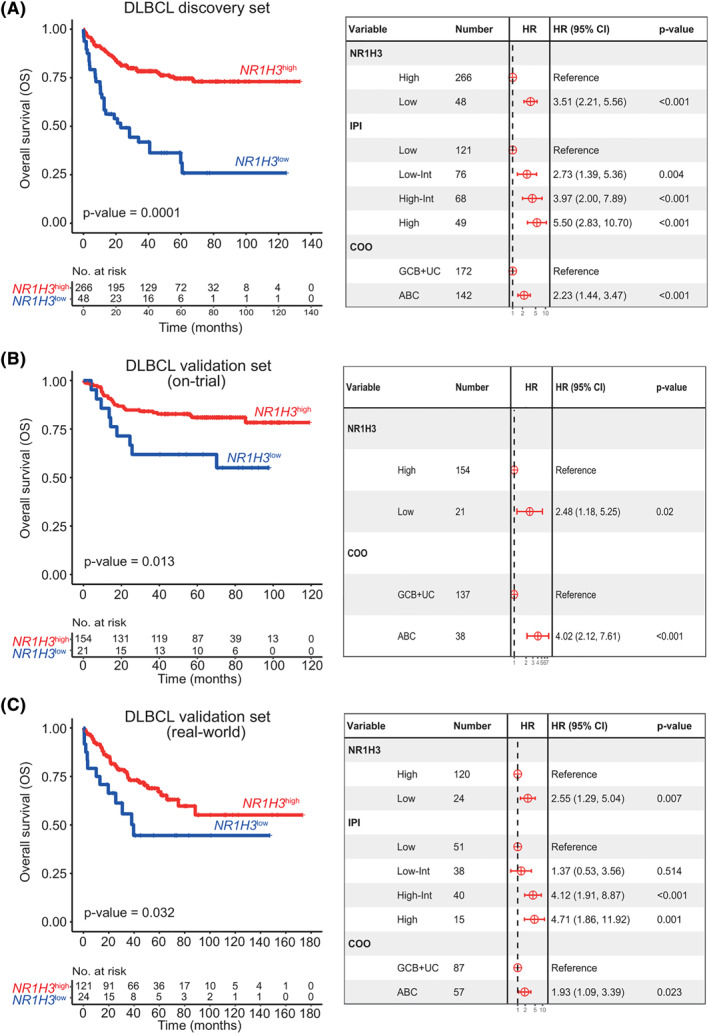
FIGURE 2.

NR1H3 prognostic significance in diffuse large B‐cell lymphomas (DLBCL). A, Kaplan Meier (KM) plot (left panel) for overall survival (OS) according to NR1H3 high (red) and NR1H3 low (blue) groups derived from maximally selected rank statistic in the discovery set of 314 DLBCL. Forest plots (right panel) visualize HR and p‐value obtained from multivariate analysis of NR1H3 groups, cell of origin, COO and IPI of the discovery set. B, KM (left panel) plot of OS comparing high‐ versus low‐NR1H3 patients (NanoString Technology) in an on‐trial validation cohort (n = 175). The right panel shows a Forest plot of multivariate analysis of OS combining NR1H3 expression and COO. C, KM curves and Forest Plot for OS of the real‐world validation cohort. KM plot displays different OS according to NR1H3 expression subgroups, whereas Forest plot indicates multivariate analysis of NR1H3 stratification, COO and IPI. Abbreviations: HR, hazard ratio; COO, cell of origin; IPI, international prognostic index
