FIGURE 3.

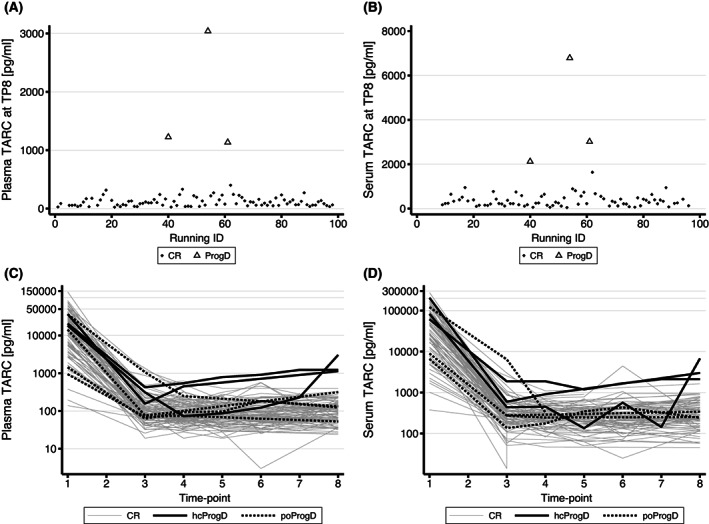
Thymus and activation‐regulated chemokine (TARC) levels at end of treatment (EOT) for patients with complete remission (CR) versus progressive disease (ProgD) based on pathological confirmation. (A) Plasma TARC levels at EOT for patients with CR versus ProgD. (B) Serum TARC levels at EOT for patients with CR versus ProgD. (C) All available serial plasma TARC values for patients. (D) All available serial serum TARC values for all patients. Grey lines represent patients in CR, the black lines represent the patients with histologically confirmed ProgD (hcProgD) and the dashed lines represent the patients with suspected ProgD at radiological assessment, but not histologically confirmed (poProgD). All patients with ProgD have a clear increase of TARC, compared to the patients in CR. Patients with a false positive radiological outcome, show no increase of TARC.
