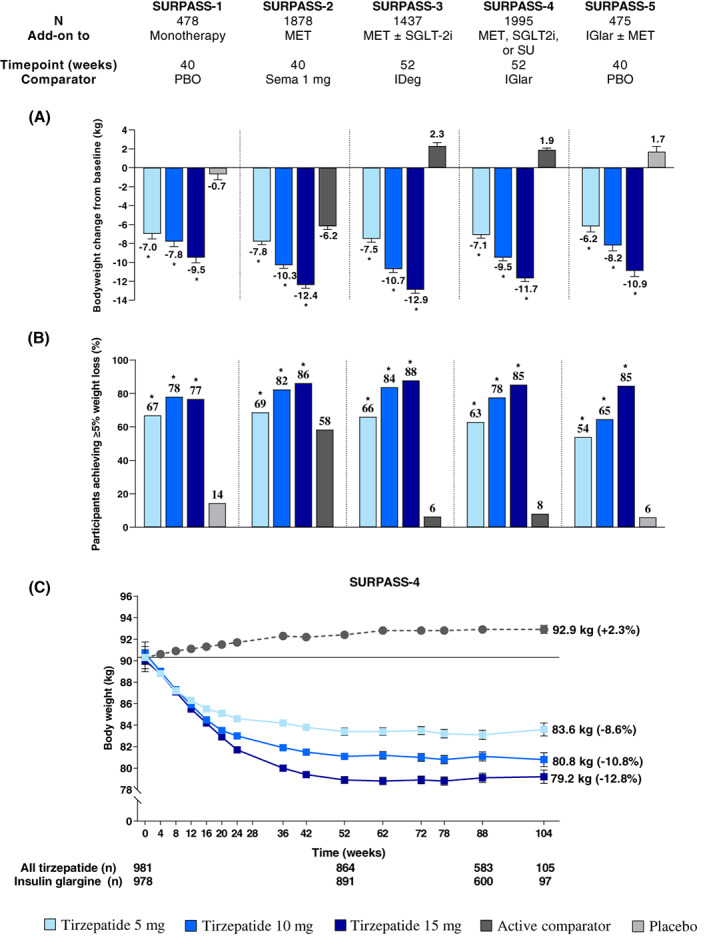
FIGURE 4.

Body weight loss with tirzepatide in SURPASS 1‐5. 56 , 73 , 74 , 75 , 76 , 87 Data are estimated mean (SE) or percentage and from the modified intention‐to‐treat population (efficacy analysis set) of each study. (A) Body weight change from baseline to the primary study endpoint; (B) proportion of participants achieving ≥5% weight loss at the primary study endpoint; (C) body weight change from baseline over time in SURPASS‐4. Solid line indicates baseline values. *p < .05 versus placebo or active comparator. IDeg, insulin degludec; IGlar, insulin glargine 100 U/ml; MET, metformin; N, number of patients who were randomly assigned and received at least one dose of study drug; PBO, placebo; Sema, semaglutide; SGLT‐2i, sodium‐glucose cotransporter‐2 inhibitor; SU, sulphonylurea
