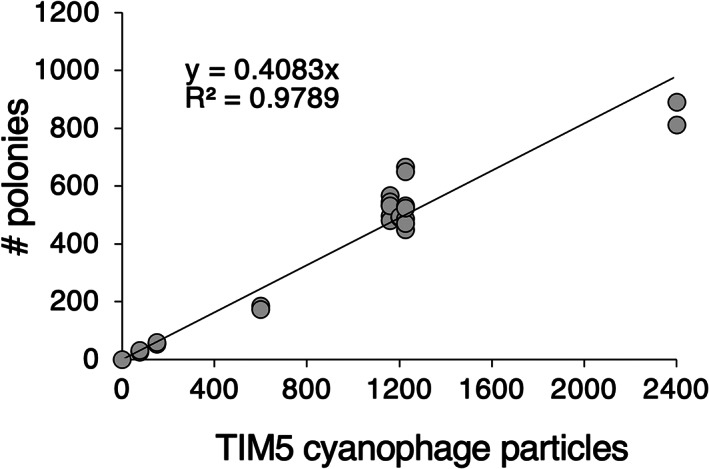
FIGURE 2.

Virus to polony conversion curve. Standard curve of polony formation using degenerate primers and probes determined for the S‐TIM5 cyanophage (n = 23). The number of input viruses was determined by epifluorescence microscopy counts of lysates.
