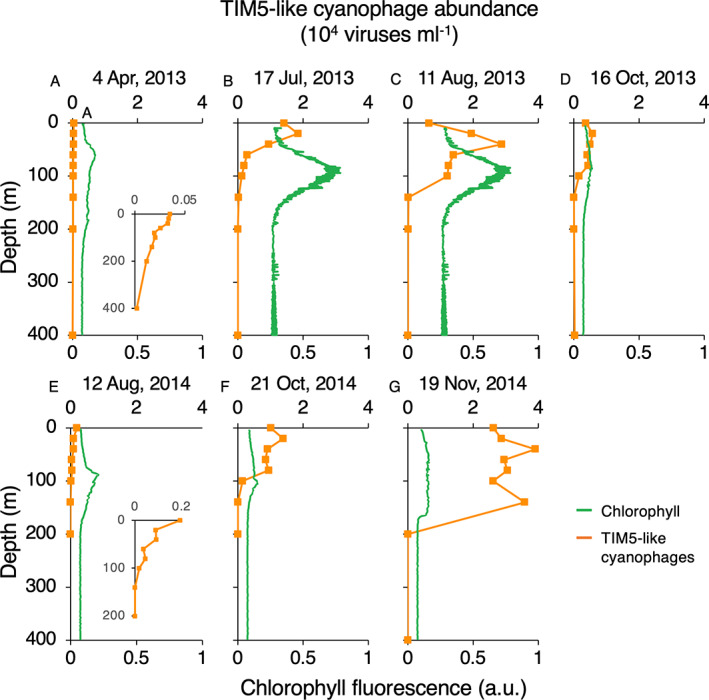
FIGURE 4.

Depth distributions of TIM5‐like cyanophages in the Red Sea. TIM5‐like cyanophage abundances (orange) and chlorophyll fluorescence (green) with depth on different dates during 2013 (A–D) and 2014 (E–G). The dates of sample collection are shown above each panel. Insets show virus distributions on an enlarged scale. Chlorophyll fluorescence is shown in arbitrary units (a.u.).
