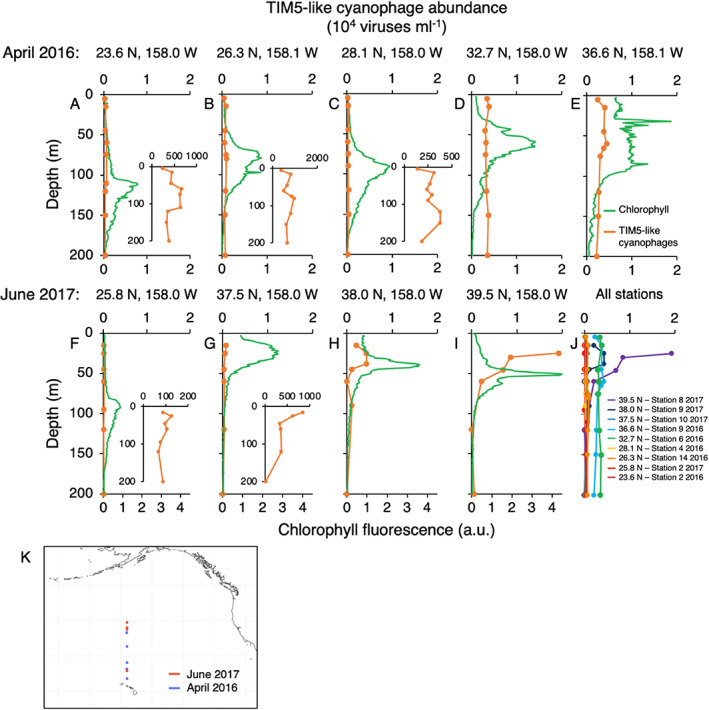
FIGURE 6.

Depth distributions of TIM5‐like cyanophages in the North Pacific Ocean. TIM5‐like cyanophage abundances (orange) and chlorophyll fluorescence (green) with depth in April 2016 (A–E) and June 2017 (F–I). Sample locations are marked above the individual panels. Insets show virus distributions on an expanded scale. (J) Combined depth profiles of TIM5‐like cyanophages from 2016 and 2017. Latitude of sampling is indicated by colour with southern latitudes represented by warm colours and northern latitude by cool colours. (K) Geographic locations of depth profiles in the North Pacific coloured by year. Chlorophyll fluorescence is shown in arbitrary units (a.u.).
