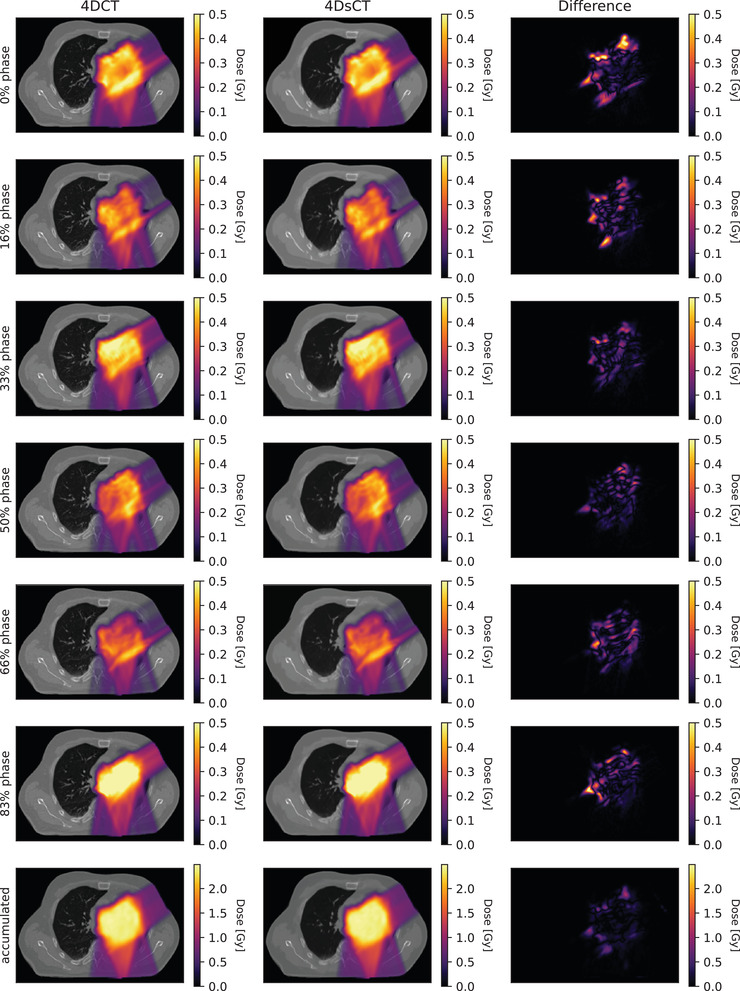
FIGURE 10.

Rows 1–6 show dose distributions for individual breathing phases (calculated with the corresponding subplans used in the dose accumulation) and the difference between 4D‐computed tomography (CT) and 4D‐synthetic computed tomography (sCT) doses. Row 7 presents the accumulated dose and dose difference. Results are shown for patient 2.
