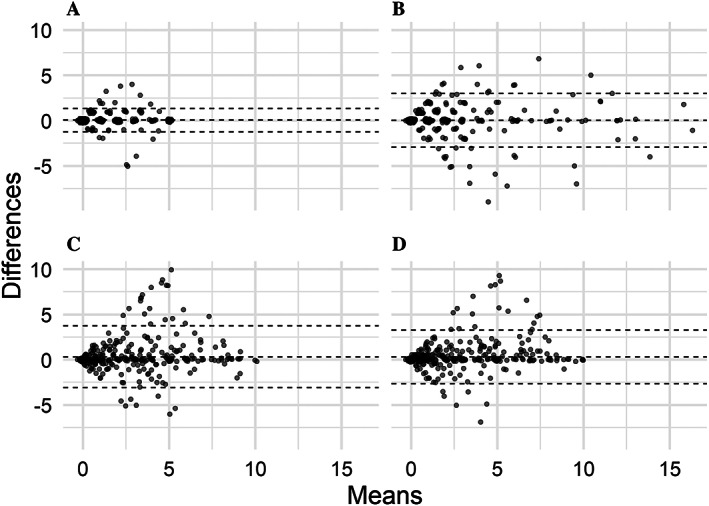
Figure 2.

Agreement between scores obtained by the morning stiffness duration (A), parent assessment of joint count (B), level of disease activity by visual analog scale (VAS) (C), and level of pain by VAS (D) measures at first and second assessment illustrated by Bland‐Altman plots. Interval between first and second assessment was 7 (interquartile range 6–7) days. Broken lines indicate the mean and 95% limit of agreement. Each dot represents an individual patient.
