
FIGURE 2.
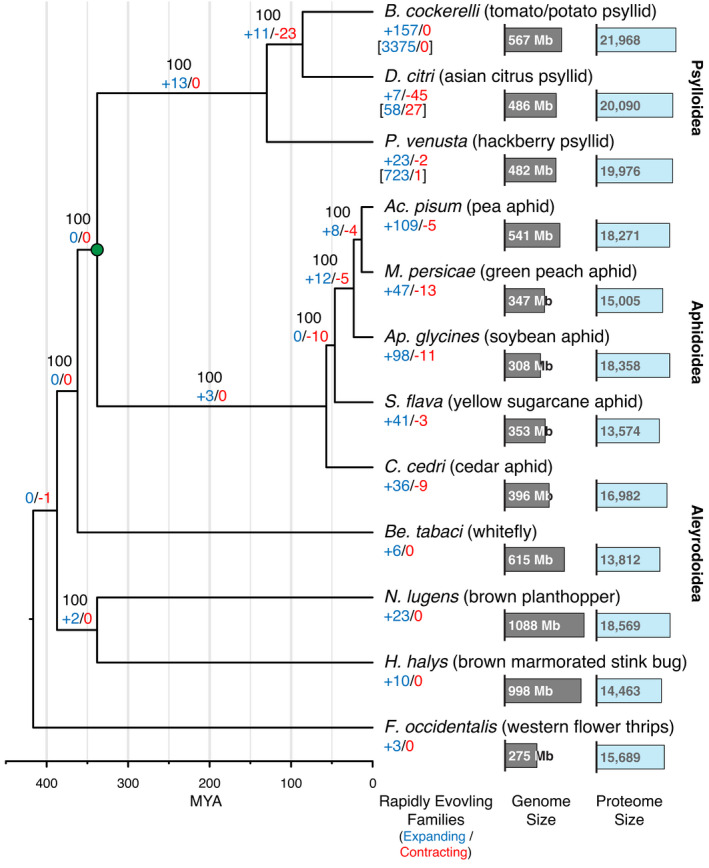
Evolutionary relationships of B. cockerelli and representative hemipterans. Maximum likelihood phylogeny of 632 conserved, single copy orthologues (a 234,854 amino acid alignment) was used as the basis to identify trends in gene family expansions and contractions (Lambda [birth‐death] = 0.0023307 – probability any gene will be gained or lost). The node marked with a green circle represents the estimated divergence between the Psylloidea and Aphidoidea of 338 Mya (Johnson et al., 2018) used to calibrate the ultrametric tree. Numbers in black at each node represent the bootstrap values, and the numbers of significantly expanding (blue) and contracting (red) gene families are also labelled. Among the Psyllodiea the number of genes represented by the expanding or contracting families are listed within brackets. Below each species name the assembled genome and proteome sizes are indicated and shown as proportionally sized horizontal bars, grey and blue, respectively