Figure 4.

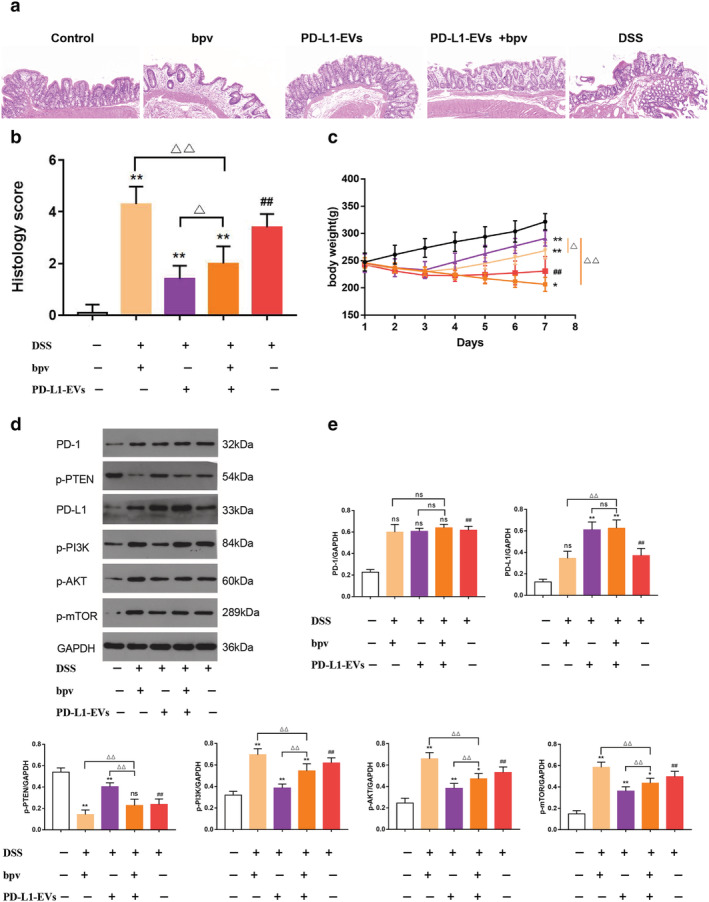
PD‐L1‐EVs alleviated colitis induced by 5% DSS in rats and regulate the expression of PI3K/Akt/mTOR pathway. (a) Histopathological changes in colon tissues analyzed by hematoxylin and eosin (HE) staining. Original magnification, 100×. (b) Histopathological score of colon sections of rats in each group. (c) The body weight of the rats in each group. (d) Western blotting analysis of PD1, p‐PTEN, PD‐L1, p‐PI3K, p‐AKT, and p‐mTOR in colon tissue. GAPDH was used as a loading control. (e) The protein quantitative analysis of PD1, p‐PTEN, PD‐L1, p‐PI3K, p‐AKT and p‐mTOR in colon tissue.(##P < 0.01, DSS group vs Control group; *P < 0.05, **P < 0.01, each treatment group vs DSS group; ns: not statistically significant, △P < 0.05, △△P < 0.01, vs PD‐L1‐EVs+bpv group). (c)  , Control;
  , bpv;
  , PD‐L1‐EVs;
  , PD‐L1‐EVs+bpv;
  , DSS [Color figure can be viewed at wileyonlinelibrary.com]
