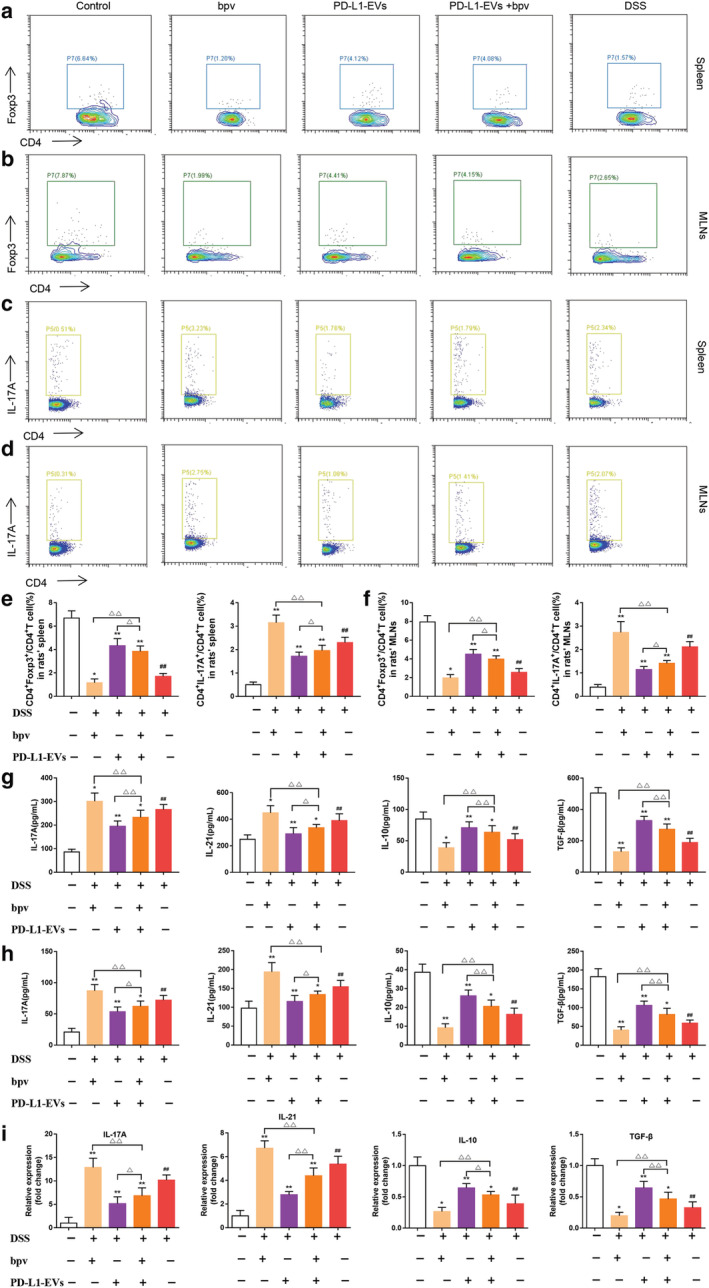
Figure 6.

PD‐L1‐EVs regulated the balance of Th17/Treg cell in colitis rats. (a) The representative FACS plots and the percentages of CD4+Foxp3+Treg cells in spleen were analyzed by flow cytometry. (b) The representative FACS plots and the percentages of CD4+Foxp3+Treg cells in MLNs were analyzed by flow cytometry. (c) The representative FACS plots and the percentages of CD4+IL‐17+Th17 cells in spleen were analyzed by flow cytometry. (d) The representative FACS plots and the percentages of CD4+IL‐17+Th17 cells in MLNs were analyzed by flow cytometry. (e) The percentages of CD4+Foxp3+Treg cells and CD4+IL‐17A+Treg cells in spleen. (f) The percentages of CD4+Foxp3+Treg cells and CD4+IL‐17A+Treg cells in MLNs. (g) ELISA analysis of IL‐17A, IL‐21, IL‐10, and TGF‐β levels in colons. (h) ELISA analysis of IL‐17A, IL‐21, IL‐10, and TGF‐β levels in serum. (i) qRT‐PCR analysis of IL‐17A, IL‐21, IL‐10, and TGF‐β mRNA expression in colons. The expression level of the mRNA was normalized to β‐actin.(##P < 0.01, DSS group vs Control group; *P < 0.05, **P < 0.01, each treatment group vs DSS group; ns, not statistically significant, △P < 0.05, △△P < 0.01, vs PD‐L1‐EVs+bpv group). [Color figure can be viewed at wileyonlinelibrary.com]
