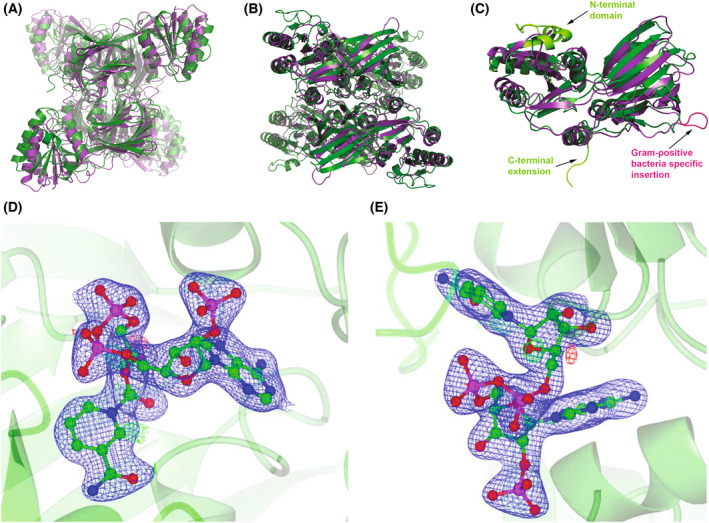
Fig. 6.

Comparison of the structure of PaNADK and LmNADK. In all panels, PaNADK and LmNADK structures are shown in green and purple, respectively. (A, B) Superimposed tetrameric form of PaNADK (PDB ID 7QVS) and LmNADK (PDB ID 2I2A) in two different orientations. (C) Superimposed monomeric form of PaNADK and LmNADK highlighting the main structural differences between the two structures, corresponding to extensions or insertions indicated on the sequence alignment (Fig. 5). (D, E) Electron density corresponding to the NADP+ bound to PaNADK. The 2F o − F c omit map (blue) at a sigma level of 3 is shown in two different orientations. Images of the structures were generated using pymol version 2.5.2, Molecular Graphics System, Schrödinger, LLC. The electron density was generated using ccp4mg‐2.10.11 software.
