
Fig. 7.
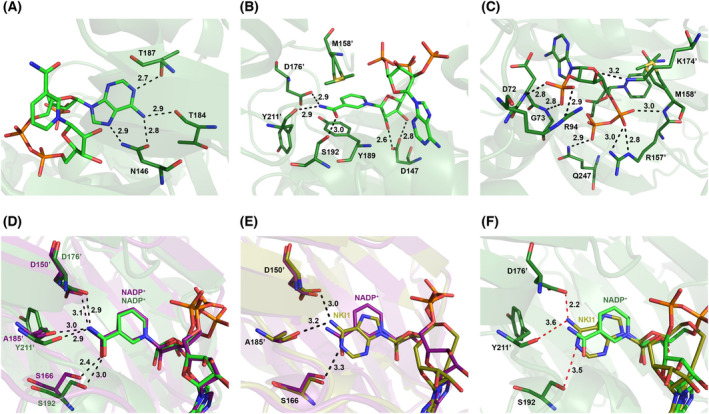
Detailed analysis of ligand binding sites of PaNADK and LmNADK. In all panels, PaNADK‐NADP+ and LmNADK‐NADP+ structures are shown in green and purple, respectively. PaNADK interactions with the different groups of NADP+: (A) adenine, (B) nicotinamide ribose and (C) diphosphate and phosphorylated ribose. (D) Comparison of the NADP+ binding sites of PaNADK and LmNADK showing a similar position of the ligand. (E) Superimposition of the structure of the LmNADK‐NADP+ (PDB ID 2I2A, in purple) and LmNADK‐NKI1 (PDB ID 6RG9, in gold) structure showing favourable interactions with both ligands. (F) Superimposition of the structure of the PaNADK‐NADP+ structure (PDB ID 7QVS, green) and PaNADK‐NKI1 model (in gold) showing unfavourable interactions with the adenine of NKI1. Images of the structures were generated using pymol version 2.5.2, Molecular Graphics System, Schrödinger, LLC.