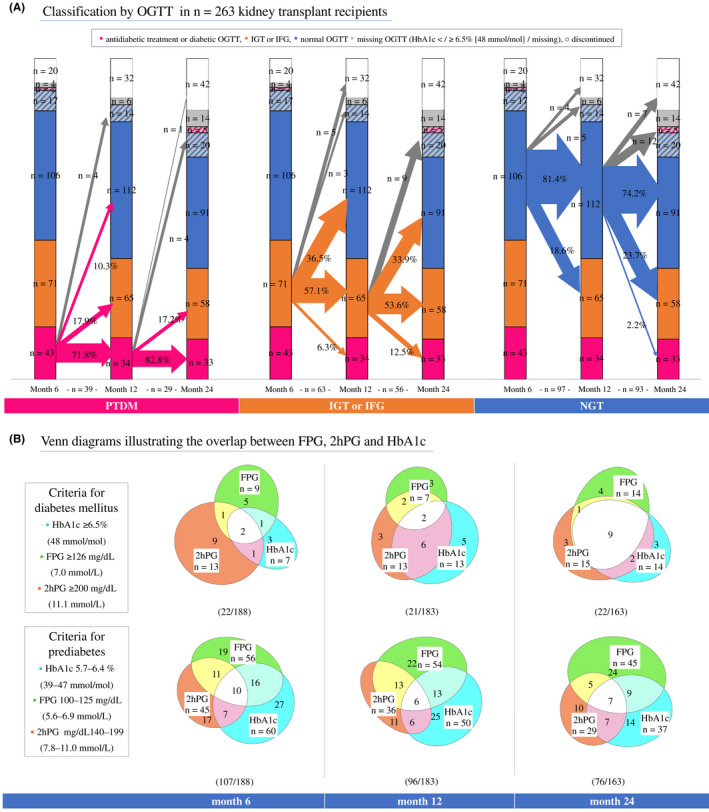
FIGURE 1.

Posttransplant diabetes mellitus evolution and concordance of diabetes criteria. (A) Diabetic status and the metabolic instability after transplantation using oral glucose tolerance testing (OGTT). The size of the crossing arrows is proportional to the number of patients changing category. Proportions of patients within the deriving category changing to another category are displayed on the arrows (excluding missing OGTT or discontinuations, gray arrows). Number of patients from which proportions are derived are below the baseline. Categories arranged from bottom up and divided into subgroups: posttransplant diabetes mellitus (pink, defined by glucose‐lowering medication or diabetic OGTT—diabetic 2hPG and/or FPG), prediabetes (IGT and/or IFG, orange), NGT = normal glucose tolerance (blue, normal 2hPG and FPG values). HbA1c measurements in participants with missing OGTT (gray) and with diabetic HbA1c (pink stripes) or normal HbA1c (blue stripes). Discontinuations (white) refer to the clinical trial dropouts (Schwaiger et al.) and not to the study flow in Figure S1. (B) Overlap of HbA1c, fasting plasma glucose (FPG), and 2‐h plasma glucose (2hPG) diagnostic criteria in participants who had both OGTT and HbA1c data available. Numbers within the categories refer to patient numbers. Diabetes and prediabetes criteria were overlapping in most patients. Therefore, the sum of patients in the upper (diabetes) and lower (prediabetes) diagrams within a group are not equivalent to the total number of patients with diabetes or prediabetes. [Color figure can be viewed at wileyonlinelibrary.com]
