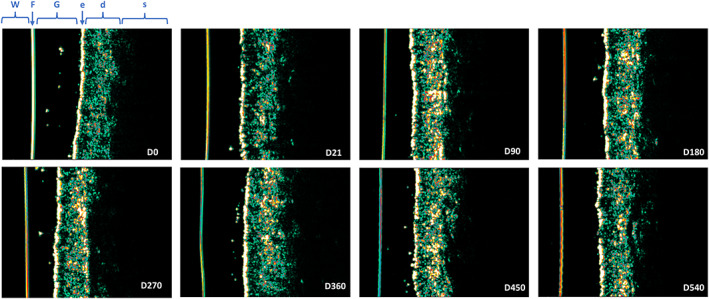
FIGURE 5.

High‐frequency ultrasound images of the left nasolabial fold in one representative subject over the whole study period (D0 to D540) after one single injection of AF Lips at D0. The color scale of echogenicity (from hyperechogenic to hypoechogenic) ranges from white‐yellow–red–green–blue–black. The echogenic density of ultrasound is based on the quantity of collagen. d, dermis; e, epidermis; F, Film; G, gel; s, subcutaneous adipose tissue; W, water.
