FIGURE 1.

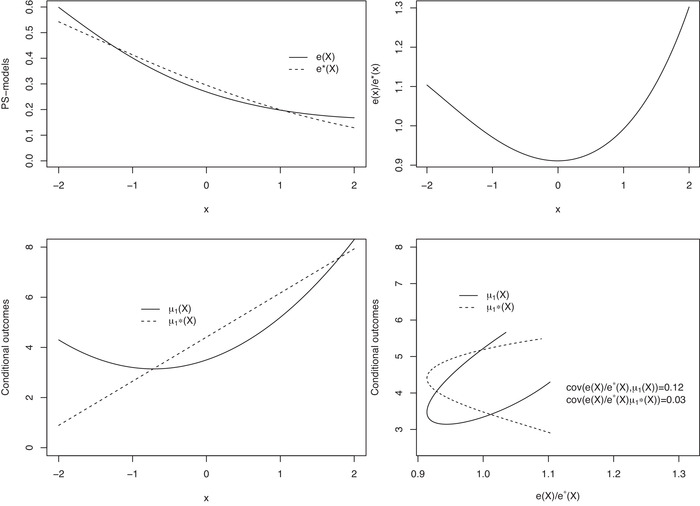
Illustration of the components of the biases using the data‐generating process from Example 2. Top left: and by X; top right: by X; bottom left: and by X; and bottom right: and by

Illustration of the components of the biases using the data‐generating process from Example 2. Top left: and by X; top right: by X; bottom left: and by X; and bottom right: and by