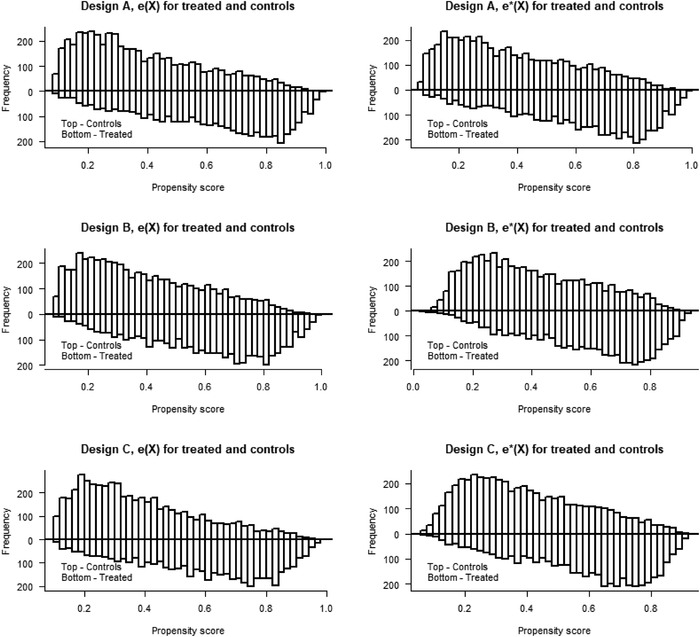
FIGURE 3.

Overlap plots for the propensity score distributions, and for treated and controls for Design A (top), B (middle), and C (bottom) in Simulation 1

Overlap plots for the propensity score distributions, and for treated and controls for Design A (top), B (middle), and C (bottom) in Simulation 1