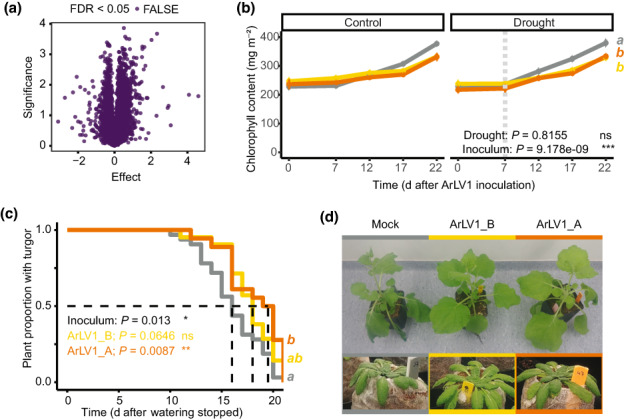
Fig. 4.

Transcriptomic and phenotypic effects of Arabidopsis latent virus 1 (ArLV1). (a) Arabidopsis thaliana Col‐0 transcriptome analysis of four samples with high ArLV1_B (Utrecht isolate) read mapping (average = 81.6%) compared with three samples with low ArLV1_B read mapping (average = 4.18%). (b) Chlorophyll content of the eighth true leaf, following ArLV1 infection in plants subjected to drought (right panel) or kept in well‐watered control conditions (left panel). Inoculation with ArLV1_A (orange), ArLV1_B (yellow) or mock virus (gray) occurred at 0 d post‐inoculation (DPI) and drought was applied at 7 DPI (vertical dotted bar) (see Methods S1). The experiment was repeated twice with similar results (n > 20). Both repeats were included in the statistical analysis using mixed linear models with repeats as a random variable. The P‐values of ‘inoculum’ or ‘drought’ represent the effect of inoculation with either ArLV1_A, ArLV1_B or buffer (mock), or the effect of the application of drought. (c) Kaplan–Meier survival curve of the fraction of plants that maintained turgor after watering was stopped (at 0 d). The log‐rank P‐value for the effect of inoculum is given as well as the Cox regression values for the two ArLV1‐inoculated groups vs mock virus. The experiment was repeated twice and results were combined for visualization and analysis. For experiments (b, c) an alpha of 0.05 was used (different letters (a, b) represent significant differences). (d) Image showing representative Nicotiana benthamiana and A. thaliana plants inoculated with ArLV1_A, ArLV1_B or mock virus displaying wilting after 4 d (N. benthamiana) or 15 d (A. thaliana) of water deprivation.
