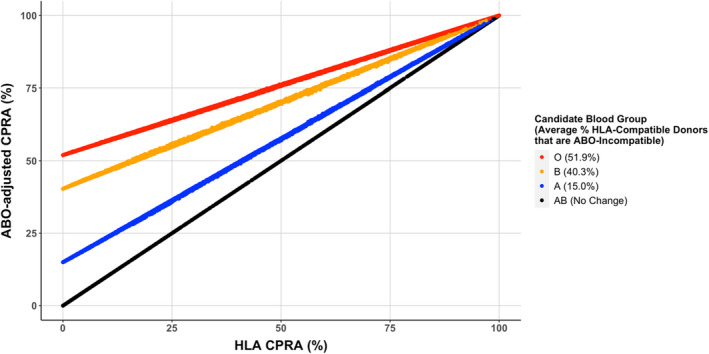
FIGURE 2.

Scatterplot of kidney waitlist candidate unified ABO‐adjusted cPRA versus conventional HLA cPRA values. Candidate ABO blood groups are highlighted in different colors, and the ABO‐adjustment results in a differential average lift off the diagonal depending on blood group. [Color figure can be viewed at wileyonlinelibrary.com]
