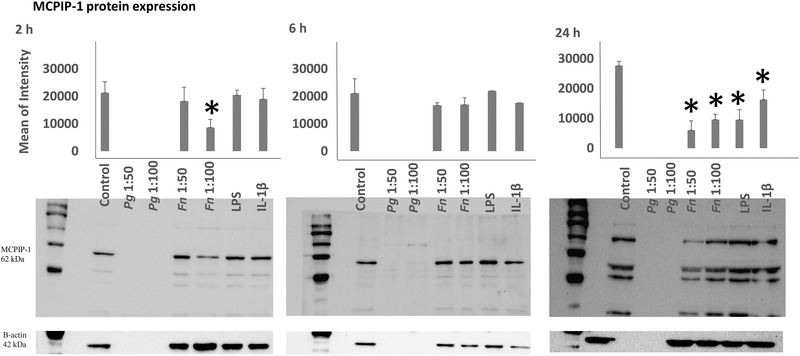
FIGURE 2.

MCPIP‐1 protein expression levels after 2, 6, and 24 h of incubation with P. gingivalis (ATCC 33277), F. nucleatum (ATCC 25586), P. gingivalis LPS, and IL‐1β. *Statistical difference (P <0.005) with control. Bars indicate mean values and standard deviations. (Fifteen μg of protein were loaded to 2 and 6 h gels and 40 μg of protein to 24 h gels)
