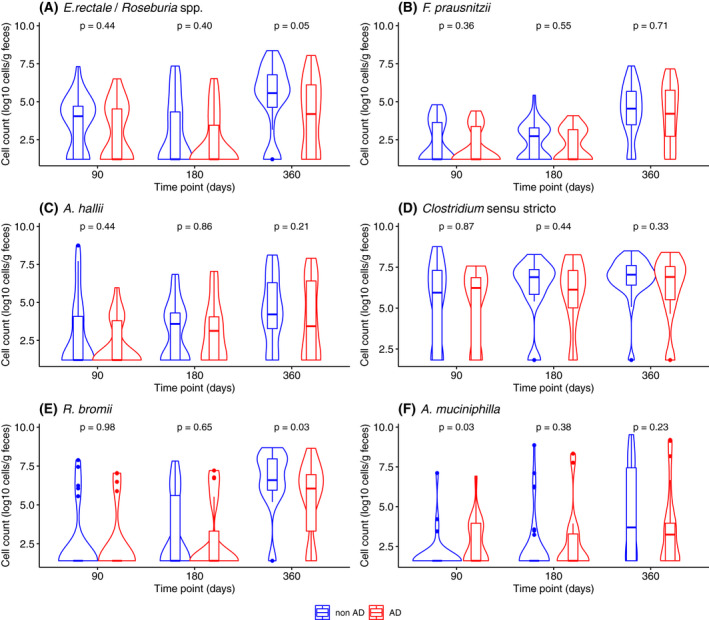
FIGURE 3.

Abundance of major butyrate‐producing groups and cross‐feeders among children with and without atopic dermatitis during their first year of life quantified by qPCR. The number of samples included in this analysis was n = 48, 54 and 66 at 90, 180 and 360 days, respectively. The violin plots describe the abundance with rotated kernel density plots, a marker and a box each indicating the median and interquartile range. p‐values were derived by Mann–Whitney U test
