Figure 2.

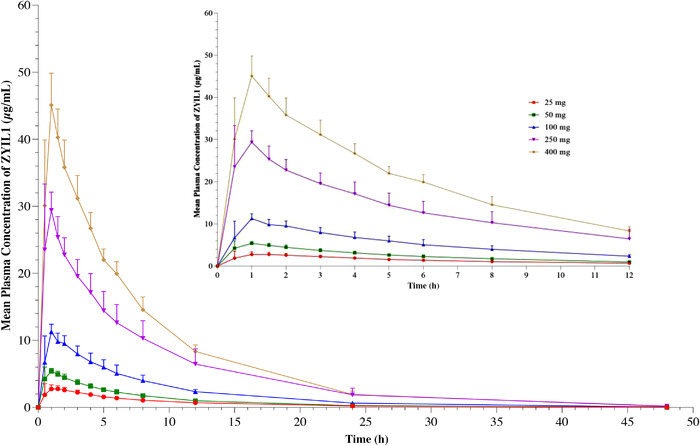
Line plot for the mean (±standard error of the mean) concentration‐time profiles for ZYIL1 after administration of 25‐, 50‐, 100‐, 250‐, and 400‐mg doses to healthy human subjects.

Line plot for the mean (±standard error of the mean) concentration‐time profiles for ZYIL1 after administration of 25‐, 50‐, 100‐, 250‐, and 400‐mg doses to healthy human subjects.