
FIGURE 1.
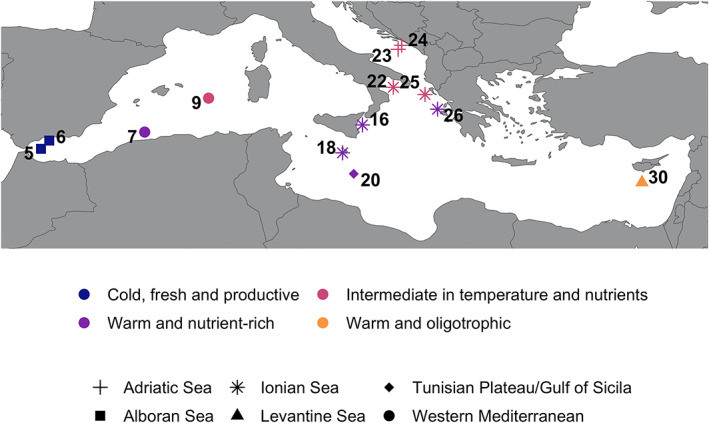
Geographic location of the 13 stations sampled during the Tara oceans for metagenomic analysis. Stations are indicated by numbers (with increasing numbers from west to east, following the Tara oceans cruise trajectory). Geographic entities are based on the marine ecoregions of the world (Spalding et al., 2007) and represented by different shapes. Environmental entities determined through principal component analysis (PCA) are indicated by colours (defined in Figure 4).