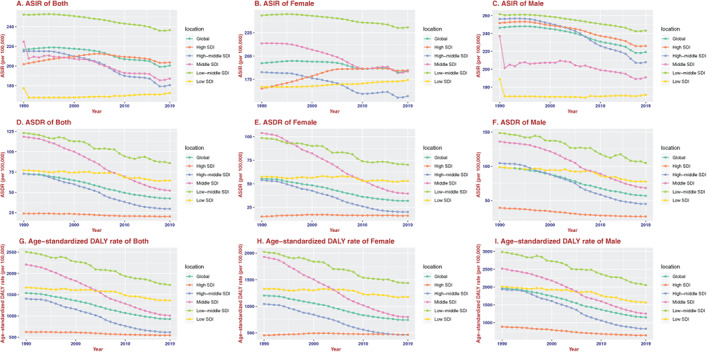
FIGURE 1.

The change trends of age‐standardized incidence, death and DALY rate among different SDI quintiles. (A) Age‐standardized both incidence. (B) Age‐standardized female incidence. (C) Age‐standardized male incidence. (D) Age‐standardized both death rate. (E) Age‐standardized female death rate. (F) Age‐standardized male death rate. (G) Age‐standardized both DALY rate. (H) Age‐standardized female DALY rate. (I) Age‐standardized male DALY rate
